Table of Contents


UNITED STATES

SECURITIES AND EXCHANGE COMMISSION

Washington, D.C. 20549


FORM 10-K


ANNUAL REPORT PURSUANT TO SECTION 13 OR 15(d) OF THE SECURITIES EXCHANGE ACT OF 1934

For the fiscal year ended December 31, 2018


TRANSITION REPORT PURSUANT TO SECTION 13 OR 15(d) OF THE SECURITIES EXCHANGE ACT OF 1934

For the Transition Period from                      to                     

Commission File Number: 814-00235


Rand Capital Corporation

(Exact name of registrant as specified in its charter)


New York   16-0961359

(State or Other Jurisdiction of

Incorporation or organization)


(IRS Employer

Identification No.)

2200 Rand Building, Buffalo, NY   14203
(Address of Principal executive offices)   (Zip Code)

Registrant’s telephone number, including area code: (716) 853-0802

Securities registered pursuant to Section 12(b) of the Act:


Title of Each Class


Name of Exchange on Which Registered

Common Stock, $0.10 par value   Nasdaq Capital Market

Securities registered pursuant to Section 12(g) of the Act: None


Indicate by check mark if the registrant is a well-known seasoned issuer, as defined in Rule 405 under the Securities Act.    Yes  ☐    No  ☒

Indicate by check mark if the registrant is not required to file reports pursuant to Section 13 or Section 15(d) of the Act.    Yes  ☐    No  ☒

Indicate by check mark whether the registrant (1) has filed all reports required to be filed by Section 13 or 15(d) of the Securities Exchange Act of 1934 during the preceding 12 months (or for such shorter period that the registrant was required to file such reports), and (2) has been subject to such filing requirements for the past 90 days.    Yes  ☒    No  ☐

Indicate by check mark whether the registrant has submitted electronically every Interactive Data File required to be submitted pursuant to Rule 405 of Regulation S-T (§232.405 of this chapter) during the preceding 12 months (or for such shorter period that the registrant was required to submit such files).    Yes  ☐    No  ☐

Indicate by check mark if disclosure of delinquent filers pursuant to Item 405 of Regulation S-K is not contained herein, and will not be contained, to the best of registrant’s knowledge, in definitive proxy or information statements incorporated by reference in Part III of this Form 10-K or any amendment to this Form 10-K.  ☒

Indicate by check mark whether the registrant is a large accelerated filer, an accelerated filer, a non-accelerated filer, a smaller reporting company or an emerging growth company. See the definitions of “large accelerated filer,” “accelerated filer”, “smaller reporting company” and “emerging growth company” in Rule 12b-2 of the Exchange Act.


Large accelerated filer      Accelerated filer  
Non-accelerated filer      Smaller reporting company  
     Emerging growth company  

If an emerging growth company, indicated by check mark if the registrant has elected not to use extended transition period for complying with any new or revised financial accounting standards provided pursuant to Section 13(a) of the Exchange Act  ☐

Indicate by check mark whether the registrant is a shell company (as defined in Rule 12b-2 of the Act).    Yes  ☐    No  ☒

The aggregate market value of the registrant’s outstanding common stock held by non-affiliates of the registrant as of June 30, 2018 was approximately $15,361,100 based upon the closing price as reported on the Nasdaq Capital Market on such date.

As of March 1, 2019, there were 6,321,988 shares of the registrant’s common stock outstanding.


Table of Contents

RAND CAPITAL CORPORATION

TABLE OF CONTENTS FOR FORM 10-K


PART I


Item 1.


Business

     1  

Item 1A.


Risk Factors

     7  

Item 1B.


Unresolved Staff Comments

     12  

Item 2.


Properties

     12  

Item 3.


Legal Proceedings

     13  

Item 4.


Mine Safety Disclosures

     13  
PART II


Item 5.


Market for Registrant’s Common Equity, Related Stockholder Matters and Issuer Purchases of Equity Securities

     14  

Item 6.


Selected Financial Data

     16  

Item 7.


Management’s Discussion and Analysis of Financial Condition and Results of Operations

     17  

Item 7A.


Quantitative and Qualitative Disclosures about Market Risk

     33  

Item 8.


Financial Statements and Supplementary Data

     34  

Item 9.


Changes in and Disagreements with Accountants on Accounting and Financial Disclosure

     77  

Item 9A.


Controls and Procedures

     77  

Item 9B.


Other Information

     77  
PART III


Item 10.


Directors, Executive Officers and Corporate Governance

     78  

Item 11.


Executive Compensation

     83  

Item 12.


Security Ownership of Certain Beneficial Owners and Management and Related Stockholder Matters

     93  

Item 13.


Certain Relationships and Related Transactions, and Director Independence

     94  

Item 14.


Principal Accountant Fees and Services

     95  
PART IV


Item 15.


Exhibits and Financial Statement Schedules

     97  

Item 16


Form 10-K Summary

     99  


Table of Contents

PART I


Item 1.

Business

Overview of Our Business

Rand Capital Corporation (“Rand”, “we”, “us” and “our”) was incorporated under the laws of New York in February 1969. Throughout our history, our principal business has been to make venture capital investments in early or expansion stage companies, often in upstate New York and regions in close proximity. In accordance with our strategic growth plan, we look for companies with strong leadership that are bringing to market new or unique products, technologies or services and have a high potential for growth. We invest in a mixture of debt and equity instruments. The debt securities typically have an equity component in the form of warrants or options to acquire stock or the right to convert the debt securities into stock. We established our small business investment company (“SBIC”) in 2002, Rand Capital SBIC, Inc. (“Rand SBIC”), whereby we utilized funds borrowed from the Small Business Administration (“SBA”) combined with our capital to invest in our portfolio companies.

Recent Developments

As previously announced, on January 24, 2019, Rand entered into a Stock Purchase Agreement (the “Stock Purchase Agreement”) by and among Rand, East Asset Management, LLC (“East”), and, solely for purposes of being bound by Sections 7.10 and 10.9(a) and (b) thereof, Rand Capital Management LLC (“RCM”). Pursuant to the terms of the Stock Purchase Agreement, at the closing of the transaction (the “Closing”), East will purchase 8,333,333.33 shares (the “Shares”) of Rand’s common stock, par value $0.10 per share, at a purchase price of $3.00 per Share for an aggregate purchase price of $25,000,000 (the “Stock Purchase”), which consideration is to be paid to Rand partially in cash and partially through the contribution of existing loans and other securities (the “Contributed Assets”). As a condition to Closing, Rand will enter into a Shareholder Agreement with East (the “Shareholder Agreement”), which provides East with the right to designate two or three persons, depending upon the size of Rand’s board of directors (the “Board”), for nomination for election to the Board.

The Stock Purchase Agreement also contemplates that, at the Closing, Rand will enter into an investment advisory and management agreement (the “Advisory Agreement”) with RCM pursuant to which RCM will serve as Rand’s external investment adviser. Pursuant to the terms of the Advisory Agreement, Rand will pay RCM a base management fee and an incentive fee. At the Closing, Rand will also enter into an administration agreement (the “Administration Agreement”) with RCM pursuant to which RCM will serve as Rand’s administrator.

The transactions contemplated by the Stock Purchase Agreement including the entry into the Advisory Agreement with RCM (which we refer to as the “Transactions”) are subject to shareholder approval. Rand has agreed to hold a special meeting of shareholders for purposes of obtaining these approvals.

Additional information regarding the Stock Purchase Agreement and the Transactions is available in Rand’s Current Reports on Form 8-K filed with the Securities and Exchange Commission on January 25, 2019. Rand is in the process of preparing and intends to file in the near future a proxy statement with the Securities and Exchange Commission for purposes of seeking to obtain shareholder approval of the Transactions.

In the event the Transactions are completed, Rand intends to accelerate its shift to an investment strategy focused on higher yielding debt investments, to elect tax treatment as a regulated investment company (“RIC”), and in connection with such RIC election to pay a special dividend to shareholders, and to adopt a new dividend policy that may include regular cash dividends to shareholders.


1


Table of Contents

Our Investment Objectives and Strategy

Our principal investment objective is to achieve long-term capital appreciation on our equity investments while maintaining a current cash flow from our debenture and pass-through equity instruments to fund expenses. Therefore, we invest in a variety of financial instruments to provide a current return on a portion of the investment portfolio. The equity features contained in our investment portfolio are structured to realize capital appreciation over the long-term and typically do not generate current income in the form of dividends or interest.

Our investment strategy is to partner with other investors to invest in small companies that either have a new product, service or technology they are trying to commercialize or are working to accelerate their rate of growth. We define small companies as businesses that may not yet be generating revenue up to companies with $20 million in revenue.

We have historically made an initial investment of $500,000 to $1,000,000 directly in a company through equity or in debt or loan instruments and frequently provide follow-on investments during our investment tenure. The loan and debt instruments we acquire generally have a maturity of not more than five years and usually are convertible or have detachable equity warrants. Interest is either paid currently or deferred. We fund new investments and operating expenses through existing cash balances, proceeds from investment exits, and interest and principal payments from our portfolio companies.

Our Investment Process

Our primary business is making debt and equity investments in small companies that meet some or all of the following criteria:

1) a qualified and experienced management team;

2) a new or unique product or service; and

3) high potential for growth in revenue and cash flow.

Our management team identifies investment opportunities through a network of investment referral relationships. Investment proposals may come to us from other sources, including unsolicited proposals from companies and referrals from accountants, bankers, lawyers and other members of the financial community. We believe that our reputation in the investment community and our experience provide a competitive advantage in originating quality investments.

In a typical private financing, our management team will review, analyze, and confirm, through due diligence, the business plan and operations of the potential portfolio company. Additionally, we familiarize ourselves with the portfolio company’s industry and competition and may conduct reference checks with its customers and suppliers.

Following our initial investment, we may make follow-on investments in the portfolio company, if needed. Follow-on investments may be made to take advantage of warrants or other preferential rights granted to us to increase or maintain our position in a promising portfolio company, or provide additional funds to allow a portfolio company to fully implement its business plans, develop a new line of business or recover from unexpected business problems. Follow-on investments in a portfolio company are evaluated individually and may be subject to SBA restrictions.


2


Table of Contents

Disposition of Investments

We may exit investments through the maturation of a debt security or when a liquidity event takes place, such as the sale, recapitalization, or initial public offering of a portfolio company. The method and timing of the disposition of our portfolio investments can be critical to the realization of maximum total return. We generally expect to dispose of our equity securities through private sales of securities to other investors or through the sale or merger of the portfolio company. We anticipate our debt investments will be repaid with interest and expect to realize further appreciation from the warrants or other equity type instruments received in connection with the investment.

Current Portfolio Companies

For a description of our current portfolio company investments, see “Item 7. Management’s Discussion and Analysis of Financial Conditions and Results of Operations – Composition of the Investment Portfolio.”

Competition

We compete for quality investments with other venture capital firms, individual investors, business development companies, and investment funds (including private equity funds and mezzanine funds), as well as traditional financial services companies such as commercial banks. We believe we are able to compete with these entities primarily on the basis of our referral network, our investing reputation and experience, our responsive, quick and efficient investment analysis and decision-making process, the investment terms we offer, and our willingness to make smaller investments.

For information concerning the competitive risks we face, see “Item 1A. Risk Factors.”

Employees

As of December 31, 2018, we had four employees, unchanged from 2017.

Organization and History

We completed our initial public offering in 1971 as an internally managed, closed-end, diversified, management investment company. We have elected to be treated as a business development company (“BDC”) under the Investment Company Act of 1940, as amended (the “1940 Act”). As a BDC we are required to comply with certain regulatory requirements as provided for in the 1940 Act and the rules and regulations promulgated thereunder. For instance, we generally have to invest at least 70% of our total assets in “qualifying assets” and provide managerial assistance to the portfolio companies in which we invest. See “Item 1. Business – Regulations, Business Development Company Regulations.”

We historically made the majority of our investments through Rand SBIC, an SBIC that has been licensed by the SBA since 2002. Rand SBIC’s predecessor was organized as a Delaware limited partnership and was converted into a New York corporation in 2008, at which time our operations as a licensed SBIC were continued. Although Rand SBIC had operated as if it were a BDC, it was registered as an investment company under the 1940 Act. In 2012, the Securities and Exchange Commission (“SEC”) granted an Order of Exemption for Rand with respect to the operations of Rand SBIC and Rand SBIC then filed an election to be regulated as a BDC under the 1940 Act. Rand SBIC’s board of directors is comprised of the directors of Rand, a majority of whom are not “interested persons” of Rand Capital or Rand SBIC.

During 2017 we established a second SBIC subsidiary, Rand Capital SBIC II, L.P. (“Rand SBIC II”), and began making investments through this SBIC subsidiary. During 2018, together with the SBA, we determined that the optimal structure was to revert back to investing in small businesses through our original SBIC, Rand SBIC, and the assets of Rand SBIC II were transferred to Rand SBIC.


3


Table of Contents

We operate as an internally managed investment company whereby our officers and employees conduct our business under the general supervision of our Board of Directors. We have not elected to qualify to be taxed as a regulated investment company (“RIC”) as defined under Subchapter M of the Internal Revenue Code.

In this Annual Report on Form 10-K, (“Annual Report”), unless the context otherwise requires, “we”, the “Corporation”, “us”, and “our” refer to Rand Corporation and Rand SBIC.

Our corporate office is located in Buffalo, NY and our website address is www.randcapital.com. We make available on our website, free of charge, our annual and periodic reports, proxy statements and other information as soon as reasonably practicable after such material is filed with the SEC. Our shares are traded on the Nasdaq Capital Market under the ticker symbol “RAND.”

Regulations

The following discussion is a general summary of the material prohibitions and descriptions governing BDCs and SBA-licensed SBICs. It does not purport to be a complete description of all of the laws and regulations affecting BDCs and SBICs.

Business Development Company Regulations

We have elected to be regulated as a BDC under the 1940 Act. Although the 1940 Act exempts a BDC from registration under that Act, it contains significant limitations on the operations of BDCs. Among other things, the 1940 Act contains prohibitions and restrictions relating to transactions between a BDC and its affiliates, principal underwriters and affiliates of its affiliates or underwriters. The 1940 Act also prohibits a BDC from changing the nature of its business so as to cease to be, or to withdraw its election as, a BDC unless so authorized by a vote of the holders of a majority of its outstanding voting securities. BDCs are not required to maintain fundamental investment policies relating to diversification and concentration of investments within a single industry. More specifically, in order to qualify as a BDC, a company must:

(1) be a domestic company;

(2) have registered a class of its equity securities or have filed a registration statement with the SEC pursuant to Section 12 of the Securities Exchange Act of 1934 (the “Exchange Act”);

(3) operate for the purpose of investing in the securities of certain types of companies, namely immature or emerging companies and businesses suffering or just recovering from financial distress. Generally, a BDC must be primarily engaged in the business of furnishing capital and providing managerial expertise to companies that do not have ready access to capital through conventional financial channels. Such companies are termed “eligible portfolio companies;”

(4) extend significant managerial assistance to such portfolio companies; and

(5) have a majority of “disinterested” directors (as defined in the 1940 Act).


Qualifying Assets

Under the 1940 Act, a BDC may not acquire any asset other than assets of the type listed in Section 55(a) of the 1940 Act, which are referred to as qualifying assets, unless, at the time the acquisition is made, qualifying assets represent at least 70% of their total assets. The 1940 Act prohibits BDCs from investing in certain types of companies, such as brokerage firms, insurance companies, investment banking firms and investment companies.


4


Table of Contents

An eligible portfolio company is, generally, a private domestic operating company, or a public domestic operating company whose securities are not listed on a national securities exchange. In addition, any small business investment company that is licensed by the SBA and is a wholly owned subsidiary of a BDC is an eligible portfolio company.

Qualifying assets include:

(1) securities of companies that were eligible portfolio companies at the time the BDC acquired their securities;

(2) securities of bankrupt or insolvent companies that were eligible at the time of the BDC’s initial acquisition of their securities but are no longer eligible, provided that the BDC has maintained a substantial portion of its initial investment in those companies;

(3) securities received in exchange for or distributed on or with respect to any of the foregoing; and

(4) cash items, government securities and high-quality short-term debt.

The 1940 Act also places restrictions on the nature of the transactions in which, and the persons from whom, securities can be purchased in order for the securities to be considered qualifying assets.

A BDC is permitted to invest in the securities of public companies and other investments that are not qualifying assets, but those kinds of investments may not exceed 30% of the BDC’s total asset value at the time of the investment. At December 31, 2018, we were in compliance with this rule.

Managerial Assistance to Portfolio Companies

In order to count portfolio securities as qualifying assets for the purpose of the 70% test discussed above, a BDC must either control the issuer of the securities or must offer to make available significant managerial assistance; except that, where the BDC purchases the securities in conjunction with one or more other persons acting together, one of the other persons in the group may make available such managerial assistance. Making available significant managerial assistance means, among other things, any arrangement whereby the BDC, through its directors, officers or employees, offers to provide and, if accepted, does so provide, significant guidance and counsel concerning the management, operations or business objectives and policies of a portfolio company through monitoring of portfolio company operations, selective participation in board and management meetings, consulting with and advising a portfolio company’s officers or other organizational or financial guidance.

Small Business Investment Company Regulations

SBA Lending Restrictions

SBICs are designed to stimulate the flow of private debt and/or equity capital to small businesses. The types and dollar amounts of the loans and other investments we may make are limited by the 1940 Act, the Small Business Act (the “SBA Act”) and SBA regulations. Rand SBIC uses funds borrowed from the SBA that can be combined with our own capital to provide loans to, and make equity investments in, businesses that meet the following criteria:

(a) have a tangible net worth not in excess of $19.5 million and average net income after U.S. federal income taxes for the preceding two completed fiscal years not in excess of $6.5 million, or

(b) meet size standards set by the SBA that are measured by either annual receipts or number of employees, depending on the industry in which the businesses are primarily engaged.


5


Table of Contents

In addition, at the end of each fiscal year, an SBIC must have at least 20% (in total dollars) invested in “smaller enterprises.” The SBA defines “smaller enterprises” as businesses that:

(a) do not have a net worth in excess of $6 million and have average net income after U.S. federal income taxes for the preceding two years no greater than $2 million, or

(b) meet size standards set by the SBA that are measured by either annual receipts or number of employees, depending on the industry in which the concerns are primarily engaged.

We have complied with these requirements since the inception of Rand SBIC.

The SBA prohibits an SBIC from providing funds to small businesses with specific characteristics, such as businesses with the majority of their employees located outside the United States, or from investing in passive or non-operating businesses, real estate, project financing, farmland, or financial lenders. Without prior SBA approval, an SBIC may not invest an amount equal to more than approximately 30% of the SBIC’s regulatory capital in any one company and its affiliates.

The SBA places limitations on the financing terms of investments by SBICs in portfolio companies such as limiting the prepayment options, the financing fees that can be charged to a portfolio company, the allowable interest rate on loan and debt securities that an SBIC can charge a portfolio company, and the maximum term of such financing. An SBIC may exercise control over a small business for a period of up to seven years from the date on which the SBIC initially acquires its control position.

The SBA restricts the ability of an SBIC to lend money to any of its officers, directors and employees or to invest in associates. The SBA also prohibits, without prior SBA approval, a “change of control” of an SBIC or transfers that would result in any person, or a group of persons acting together, owning 10% or more of a class of capital stock of a licensed SBIC. A “change of control” is any event which would result in the transfer of the power, direct or indirect, to direct the management and policies of an SBIC, whether through ownership, contractual arrangements or otherwise.

Rand SBIC may invest directly in a portfolio company’s equity, but may not become a general partner of a non-incorporated entity or otherwise become jointly or severally liable for the general obligations of a non-incorporated entity. Rand SBIC may acquire options or warrants in portfolio companies, and the options or warrants may have redemption provisions, subject to certain restrictions. Pursuant to SBA regulations, the maximum cash which may be invested in any one portfolio company by Rand SBIC is currently $4.8 million.

In addition the SBA regulations require an examination of a licensed SBIC by an SBA examiner to determine the SBIC’s compliance with the relevant SBA regulations. Our annual report, submitted to the SBA, must be audited by an independent public accounting firm.

SBA Leverage

The SBA raises capital to enable it to provide funds to SBICs by guaranteeing certificates or bonds that are pooled and sold to purchasers of the government guaranteed securities. The amount of funds that the SBA may lend to SBICs is determined by annual Congressional appropriations.

SBA debentures are issued with ten year maturities. Interest only is payable semi-annually until maturity. All of our outstanding SBA debentures may be prepaid without penalty. To reserve the approved SBA debenture leverage, we paid an upfront 1% commitment fee to the SBA as a partial prepayment of the SBA’s nonrefundable 3% leverage fee. These fees are expensed over the life of the corresponding SBA debenture


6


Table of Contents

instruments. The SBA, as a creditor, will have a superior claim to Rand SBIC’s assets over our shareholders in the event we liquidate Rand SBIC or the SBA exercises its remedies under the SBA-guaranteed debentures issued by Rand SBIC upon an event of default.

At December 31, 2018, we had $8,750,000 in outstanding SBA debenture instruments.


Item 1A.

Risk Factors

Risks related to our business and structure

Our financial results will depend on our skill to manage and deploy capital effectively

Our ability to achieve long-term capital appreciation on our equity investments while maintaining a current cash flow from our debenture and pass-through equity instruments depends on our capability to effectively identify, invest and manage our capital.

Accomplishing this investment objective effectively will be based on our management team’s handling of the investment process, starting with its ability to find investments that offer favorable terms and meet our investment objective. They will also have to monitor the portfolio company’s performance and may be called upon to provide managerial assistance. These demands on their time may distract them or may slow the rate of investment.

Even if we are able to grow and build on our investment, any failure to manage our growth effectively could have a material adverse effect on our business, financial condition, results of operations and prospects. If we cannot successfully operate our business or implement our investment objective, it could negatively impact our stock price.

We are subject to risks created by our regulated environment

We are regulated by the SEC and the SBA. Changes in the laws or regulations that govern BDCs and SBICs could significantly affect our business. Regulations and laws may be changed periodically, and the interpretations of the relevant regulations and laws are also subject to change. Any change in the regulations and laws governing our business could have a material impact on our financial condition and our results of operations. Moreover, the laws and regulations that govern BDCs and SBICs may place conflicting demands on the manner in which we operate, and the resolution of those conflicts may restrict or otherwise adversely affect our operations.

We are subject to risks created by borrowing funds from the SBA

Our liabilities include debt instruments issued through the SBA which have fixed interest rates. Until and unless we are able to invest substantially all of the proceeds from debentures at annualized interest or other rates of return that substantially exceed annualized interest rates that Rand SBIC must pay the SBA, our operating results may be adversely affected which may, in turn, depress the market price of our common stock.

In addition, our outstanding $8,750,000 in SBA debentures will reach maturity and become payable between 2022 and 2029. In order to repay our outstanding SBA debentures, we will need to identify sources of additional funding if the proceeds received upon the exits of our investments are insufficient to fund our operations and repay our SBA obligations. We cannot be assured that the proceeds to be received upon the exits from our investments will be sufficient to meet our funding needs or, if such proceeds are insufficient, that we will be able to obtain access to the necessary funding on terms that are acceptable to us.


7


Table of Contents

We are subject to risks created by the valuation of our portfolio investments

At December 31, 2018, 100% of our investments are in private securities that are not publicly traded. There is typically no public market for securities of the small privately held companies in which we invest. Investments are valued in accordance with our established valuation policy and are stated at fair value as determined in good faith by management and approved by our Board of Directors. In the absence of a readily ascertainable market value, the estimated value of our investment portfolio may differ significantly, favorably or unfavorably, from the values that would be placed on the portfolio if a ready market for the securities existed. Any changes in estimated value are recorded in the consolidated statement of operations as “Net change in unrealized depreciation or appreciation on investments.”

We are dependent upon key management personnel for future success

We are dependent on the skill, diligence, and the network of business contacts of our executive officers for the sourcing and selection, structuring, closing, monitoring and valuation of our investments. Our future success depends, to a significant extent, on the continued employment of these officers and their departure could materially adversely affect our ability to implement our business strategy. We do not maintain key man life insurance or employment agreements on the officers.

We operate in a competitive market for investment opportunities

We operate in a competitive market for investment opportunities. We face competition in our investing activities from many entities including other SBICs, private venture capital funds, investment affiliates of large companies, wealthy individuals and other domestic or foreign investors. The competition is not limited to entities that operate in the same geographical area as we do. As a regulated BDC, we are required to disclose quarterly and annually the name and business description of our portfolio companies and the value of their portfolio securities. Most of our competitors are not subject to this disclosure requirement. This obligation to disclose this information could hinder our ability to invest in potential portfolio companies. Additionally, other regulations, current and future, may make us less attractive as a potential investor to a given portfolio company than a private venture capital fund.

We are subject to cyber security risks and incidents that may adversely affect the operations of our company or the companies in which we invest. A failure in our cyber security systems could impair our ability to conduct business and damage our business relationships, compromise or corrupt our confidential information and ultimately negatively impact business, financial condition and operating results.

Our operations are dependent on secure information technology systems for data processing, storage and reporting. Increased cyber security vulnerabilities, threats and more sophisticated and targeted cyber-attacks pose a risk to the security of our information and the information of our portfolio companies. These cyber-attacks could affect our computer network, our website or our service providers (such as, but not limited to, accountants, lawyers, and transfer agents) and could result in operating disruptions or information misappropriation, which could have a material adverse effect on our business operations and the integrity and availability of our financial information. We have attempted to mitigate these cybersecurity risks by employing a number of processes, procedures and internal controls within our company but we remain potentially vulnerable to additional known and unknown threats.


8


Table of Contents

We may experience fluctuations in our quarterly results

Our quarterly operating results may fluctuate significantly as a result of a number of factors. These factors include, among others, variations in and the timing of the recognition of realized and unrealized gains or losses, the degree to which portfolio companies encounter competition in their markets, their ability to raise additional capital, if needed, and general economic conditions. As a result of these factors, results for any quarter cannot be relied upon as being indicative of performance in future quarters or for a full year.

Risks related to our investments

We have a limited number of companies in our portfolio of investments, and may be subjected to greater risk if any of these companies default

Our portfolio investment values are concentrated in a small number of companies and as such, we may experience a significant loss in our net asset value if one or more of these companies performs poorly or goes out of business. The unrealized or realized depreciation in the value of the securities of any one of these companies would negatively impact our net asset value.

The lack of liquidity in our investments may adversely affect our business

We invest, and will continue to invest, in portfolio companies whose securities are not publicly traded and may be subject to restrictions on resale, and as a result will be less liquid than publicly traded securities. Most of our investments are or will be either equity securities or subordinated debt securities acquired directly from small, private companies. The illiquidity of most of our portfolio may adversely affect our ability to dispose of the securities at times when it may be advantageous for us to liquidate investments. In addition, we may not realize the full value of these private investments if we have to liquidate all or a part of our portfolio investment quickly, given the lack of available markets for their sale.    

Economic downturns or recessions may adversely affect our portfolio companies’ financial performance and therefore harm our operating results

The United States economy has periodically experienced periods of instability and recessions and the financial results of the small companies in which we invest could be more acutely affected negatively by this instability and suffer deterioration in operational or financial results. This deterioration may have a negative effect on our financial performance.

Investing in private companies involves a high degree of risk

We typically invest a substantial portion of our assets in small private companies. These private businesses may be thinly capitalized, unproven companies with risky technologies, products or services, may lack management depth, and may not have attained profitability. Because of the speculative nature and the lack of a public market for these investments, there is significantly greater risk of loss than is the case with securities traded on a public exchange. We expect that some of our investments will become worthless and that some will appear likely to become successful but will never realize their potential. We have been risk seeking rather than risk averse in our approach to our investments.

Even if our portfolio companies are able to develop commercially viable technologies, products or services, the market for those new technologies, products and services is likely to be highly competitive and rapidly changing. Commercial success is difficult to predict and the marketing efforts of the portfolio companies may not be successful.


9


Table of Contents

We generally do not control our portfolio companies

We do not have an expectation to control the decision making in our portfolio companies, even though we may have a board seat or board observation rights. Because of this, we are subject to the risk that our portfolio companies will make business decisions with which we disagree or will incur risks or otherwise act in ways that do not maximize their value and serve our interests as minority debt and equity holders. Due to the lack of liquidity in our investments in these private companies, we may not be able to dispose of our investment in these portfolio companies as freely as we would like or at a valuation that is appropriate. As a result, a portfolio company may make decisions that would decrease the value of our portfolio holdings.

We typically are minority shareholders in our portfolio companies

We typically invest as a minority shareholder in our portfolio companies. As a minority shareholder we are unable to require the company to seek or entertain liquidity events as a way to exit our investments. This may cause us to hold investments longer than planned or to seek a sale that may not reflect the full value of our investment.

We may not have the funds or ability to make follow-on investments in our portfolio companies

We may not have the funds or ability to make additional investments in our portfolio companies. After our initial investment in a company, we may be asked to participate in another round of financing to the company. There is no assurance that we will make, or have sufficient funds to make, these follow-on investments. Any decision to not make an additional investment in a portfolio company may have a negative impact on the portfolio company in need of the capital, and have a negative impact on our ownership in the company.

Risks related to our common stock

Investing in our shares may be inappropriate for an investor’s risk tolerance

Our venture capital investments, in accordance with our investment objective and principal strategies, result in a greater than average amount of risk and volatility and may result in loss of principal. Our investments in portfolio companies are highly speculative and aggressive and, therefore, an investment in our shares may not be suitable for investors for whom such risk is inappropriate. Neither our investments nor an investment in our shares constitutes a balanced investment program.

Sales of substantial amounts of our common stock may have an adverse effect on the market price of our securities.

Sales of substantial amounts of our common stock, or the availability of such securities for sale, could adversely affect the prevailing market prices for our common stock.

Our shares often trade at a discount to our net asset value

Shares of business development companies may trade at a market price that is less than the net asset value that is attributable to those shares and our shares have often traded at such a discount. This characteristic of closed-end investment companies is separate and distinct from the risk that our net asset value per share may decline. It is not possible to predict if, or when, our shares will trade at, above, or below net asset value.


10


Table of Contents

Risks related to the transactions contemplated by the Stock Purchase Agreement

The failure to complete the Transactions may result in a decrease in the market value of our shares.

After the Transactions were announced on January 24, 2019, the market price for our shares of common stock rose significantly. The Transactions are subject to a number of contingencies, including approval by our shareholders and the other closing conditions set forth in the Stock Purchase Agreement. As a result, there is a risk that the Transactions will not be completed. If the Transactions are not completed for any reason or are delayed for a significant period of time, the market price of our shares may decline, including to a price per share that is below the price per share on the date that the Transactions were announced.

If the Transactions are not consummated, there may not be any other offers from potential acquirers or parties interested in a potential strategic transaction.

If the Transactions are not consummated, we may seek another strategic transaction. Although we have had prior discussions with other parties regarding a strategic transaction, these parties may no longer have an interest in a strategic transaction with Rand, or be willing to offer acceptable terms in a transaction.

If we do not complete the Transactions, we may continue to face challenges and uncertainties in our ability to achieve business success.

Historically, Rand has focused on a total return strategy that involved seeking long-term capital appreciation on its equity investments, while maintaining a current cash flow from debt investments and pass-through equity instruments to fund expenses. Rand has observed that this total return strategy has become disfavored among investors resulting in an increasingly larger spread between the share price for the Common Stock and our Net Asset Value (NAV) per share. If the Transactions are not completed, we will not engage an external investment adviser to manage our investment strategy and will remain, for the time being, an internally managed BDC that is likely to continue the same legacy total return strategy. Therefore, if we are unable to complete the Transactions, we may continue to operate our business in a manner that is substantially similar to the manner in which it is currently operated, and would continue to face the same business challenges and uncertainties associated with our current business strategy.

Under certain circumstances, a termination fee may be payable by Rand upon termination of the Stock Purchase Agreement.

The Stock Purchase Agreement provides for the payment by Rand of a termination fee of up to $750,000 if the Stock Purchase Agreement is terminated under certain circumstances. Given our financial condition and amount of cash and cash equivalents on hand, payment of the termination fee in an amount up to $750,000 would likely have a material adverse effect on our financial condition and on our ability to make any significant new investments or follow-on investments in the near future.

The Stock Purchase Agreement contains restrictions limiting our ability to pursue alternatives to the Transactions.

The Stock Purchase Agreement contains provisions that limit our ability to actively solicit, discuss or negotiate competing third-party proposals for strategic transactions. These provisions, which are typical for transactions of this type, and include the termination fee payable under certain circumstances, might discourage a competing acquirer that might have an interest in acquiring all or a significant part of Rand from considering or proposing a transaction even if it were prepared to pay consideration with a higher price than that to be paid by East in the Stock Purchase Agreement or might result in a potential competing acquirer proposing to pay a lower price to acquire Rand than it might otherwise have proposed to pay without Rand’s requirement to pay the termination fee in order to terminate the Stock Purchase Agreement to accept a superior proposal.


11


Table of Contents

The failure of satisfy the closing conditions under the Stock Purchase Agreement, including receipt of shareholder approvals, will result in the Transactions not being completed.

The Transactions are subject to closing conditions, including certain approvals of shareholders and approval of the SBA, which, if not satisfied, will prevent the Transactions from being completed. The closing condition requiring shareholder approvals may not be waived under applicable law and must be satisfied for the Transactions to be completed. In addition to the required approvals from the shareholders, the Transactions are subject to a number of other conditions, some of which are beyond our direct control. We cannot predict when the conditions set forth in the Stock Purchase Agreement will be satisfied or if they will be satisfied at all.

The Company will be subject to operational uncertainties and contractual restrictions while the Transactions are pending.

Uncertainty about the effect of the Transactions may have an adverse effect on Rand while the Transactions are pending. These uncertainties may impair Rand’s ability to retain key personnel until the Transactions are consummated and could cause those that deal with Rand to seek to change their existing relationships with Rand. In addition, the Stock Purchase Agreement imposes limitations on Rand with respect to actions that it can take while the Transactions are pending, which may result in us not pursuing or being unable to pursue certain business opportunities that may arise prior to the completion of the Transactions.

If the Transactions do not close, the Company will not benefit from the expenses incurred in furtherance of the Transactions.

If the Transactions are not completed, Rand will have incurred substantial expenses for which no ultimate benefit will have been received. Rand has incurred, and will continue to incur, out-of-pocket expenses in connection with the Transactions for investment banking, legal and accounting fees and other expenses, much of which will be incurred even if the Transactions are not completed.

If we complete the Transactions, we will face risks associated with the terms and structure of the Transactions.

If the Transactions are completed, there are risks arising from the terms and structure of the Transactions, including the following:


Despite our expressed intentions, we may not declare or pay a special dividend or regular cash dividends to shareholders.


East will exercise significant influence in connection with its ownership of Common Stock.


RCM has no prior experience managing or acting as an investor adviser for a BDC.


We will be dependent upon RCM for our future success.


There are potential conflicts of interest, including the management of other investment funds and accounts by the principals and certain members of the Investment Committee of RCM, which could impact our investment returns.


Our ability to enter into transactions with affiliates of RCM will be restricted.


Item 1B.

Unresolved Staff Comments

Not applicable.


Item 2.

Properties

We currently lease office space in Buffalo, New York for our corporate headquarters. We believe that these leased facilities are adequate to support our current staff and expected future needs.


12


Table of Contents
Item 3.

Legal Proceedings

None.


Item 4.

Mine Safety Disclosures

Not applicable.


13


Table of Contents

Part II


Item 5.

Market for Registrant’s Common Equity, Related Stockholder Matters and Issuer Purchases of Equity Securities

Our common stock (“Common Stock”) is traded on the Nasdaq Capital Market (“Nasdaq”) under the symbol “RAND.”

We have historically not paid any cash dividends to shareholders. Unless the transactions contemplated by the Stock Purchase Agreement are completed, we have no present intention of paying cash dividends in the foreseeable future.

Issuer Purchases of Equity Securities


Period

   Total number of
shares purchased
(1)
     Average price paid
per share (2)
     Total number of shares
purchased as part of
publicly
announced plan (3)
    Maximum number of
shares that may yet be
purchased under the share
repurchase plan (3)
 

10/1 – 10/31/2018

     —          —          —         458,954  

11/1 – 11/30/2018

     —          —          —         458,954  

12/1 – 12/31/2018

     —          —          —         458,954  


(1)

There were no shares repurchased during the fourth quarter of 2018.

(2)

The average price paid per share is calculated on a settlement basis and includes commission.

(3)

On October 25, 2018, the Board of Directors extended the repurchase authorization of up to 1,000,000 shares of the Common Stock on the open market at prices no greater than the then current net asset value through October 25, 2019.

Shareholders of Record

On March 1, 2019, we had a total of approximately 908 shareholders, which included 77 record holders of our Common Stock, and an estimated 831 holders with shares beneficially owned in nominee name or under clearinghouse positions of brokerage firms or banks.


14


Table of Contents

Corporation Performance Graph

The following graph shows a five-year comparison of cumulative total shareholder returns for our Common Stock, the Nasdaq Market Index, and an old and new Peer Group, assuming a base index of $100 at the end of 2013. The cumulative total return for each annual period within the five years presented is measured by dividing (1) the sum of (A) the cumulative amount of dividends for the measurement period, assuming dividend reinvestment, and (B) the difference between share prices at the end and at the beginning of the measurement period by (2) the share price at the beginning of the measurement period.


LOGO

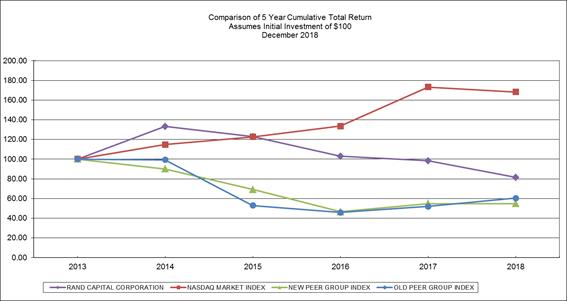
Comparison of cumulative total return of one or more companies, peer groups, industry indexes and/or broad markets


     YEAR ENDED DECEMBER 31,  

Company/Index/Market

   2013      2014      2015      2016      2017      2018  

Rand Capital Corporation

   $ 100.00      $ 133.22      $ 122.80      $ 102.93      $ 98.37      $ 81.46  

NASDAQ Market Index

   $ 100.00      $ 114.75      $ 122.74      $ 133.62      $ 173.22      $ 168.30  

New Peer Group Index

   $ 100.00      $ 90.09      $ 69.29      $ 46.63      $ 54.92      $ 54.75  

Old Peer Group Index

   $ 100.00        99.36      $ 52.83      $ 45.78      $ 51.88      $ 60.37  

The New Peer Group was comprised of the following companies:

Equus Total Return, Inc. (NYSE: EQS)

Firsthand Technology Value Fund, Inc. (NasdaqGS: SVVC)

GSV Capital Corp. (NasdaqCM: GSVC)

180 Degree Capital Corp. (NasdaqGM: TURN)

The Old Peer Group was comprised of the following companies:

Capital Southwest Corporation (NasdaqGS: CSWC)

Firsthand Technology Value Fund, Inc. (NasdaqGS: SVVC)

GSV Capital Corp. (NasdaqCM: GSVC)

180 Degree Capital Corp. (NasdaqGM: TURN)

We selected the New Peer Group because it is our belief that the four issuers in the group have investment objectives that are similar to ours, and among the publicly traded companies, they are relatively similar in size to us. Capital Southwest was removed from our peer group to reflect the change in their business strategy.

The performance graph information provided above will not be deemed to be “soliciting material” or “filed” with the SEC or subject to Regulations 14A or 14C, or to the liabilities of section 18 of the Securities Exchange Act, unless in the future we specifically request that the information be treated as soliciting material or specifically incorporate it by reference into any filing under the Securities Act or the Exchange Act.


15


Table of Contents
Item 6.

Selected Financial Data

The following table provides selected consolidated financial data for the periods indicated. You should read the selected financial data set forth below in conjunction with Item 7, “Management’s Discussion and Analysis of Financial Condition and Results of Operations,” and with the consolidated financial statements and related notes appearing within Item 8 of this Annual Report.


     Balance Sheet Data as of December 31:  
     2018     2017     2016     2015     2014  

Total assets

   $ 40,521,724     $ 40,133,913     $ 42,418,530     $ 44,562,060     $ 45,525,987  

Total liabilities

   $ 8,997,537     $ 8,215,228     $ 9,789,167     $ 10,708,400     $ 13,172,546  

Net assets

   $ 31,524,187     $ 31,918,685     $ 32,629,363     $ 33,853,660     $ 32,353,441  

Net asset value per outstanding share

   $ 4.99     $ 5.05     $ 5.16     $ 5.35     $ 5.11  

Shares of common stock outstanding

     6,321,988       6,321,988       6,321,988       6,328,538       6,328,538  
     Operating Data for the Years Ended December 31:  
     2018     2017     2016     2015     2014  

Investment income

   $ 2,106,954     $ 1,454,782     $ 1,031,858     $ 2,824,337     $ 2,584,475  

Total expenses

   $ 2,193,672     $ 2,010,977     $ 3,401,037     $ 1,817,279     $ 2,499,297  

Net investment (loss) gain, net of tax

   ($ 68,406   ($ 19,298   ($ 1,553,268   $ 842,902     $ 21,835  

Net realized (loss) gain on sales and dispositions of investments, net of tax

   ($ 994,295   $ 88,684     $ 8,864,653     ($ 27,973   $ 4,767,484  

Net increase (decrease) in unrealized depreciation or appreciation on investments, net of tax

   $ 668,203     ($ 780,064   ($ 8,514,068   $ 685,290     ($ 247,838

Net (decrease) increase in net assets from operations

   ($ 394,498   ($ 710,678   ($ 1,202,683   $ 1,500,219     $ 4,541,481  


16


Table of Contents
Item 7.

Management’s Discussion and Analysis of Financial Condition and Results of Operations

You should read the following discussion and analysis of our financial condition and results of operations in conjunction with the consolidated financial statements and related notes included within Item 8 of this Annual Report.

FORWARD LOOKING STATEMENTS

Statements included in this Management’s Discussion and Analysis of Financial Condition and Results of Operations and elsewhere in this Report that do not relate to present or historical conditions are “forward-looking statements” within the meaning of that term in Section 27A of the Securities Act of 1933, as amended, and in Section 21E of the Securities Exchange Act of 1934, as amended. Additional oral or written forward-looking statements may be made by us from time to time, and forward-looking statements may be included in documents that are filed with the SEC. Forward-looking statements involve risks and uncertainties that could cause our results or outcomes to differ materially from those expressed in the forward-looking statements. Forward-looking statements may include, without limitation, statements relating to our plans, strategies, objectives, expectations and intentions and are intended to be made pursuant to the safe harbor provisions of the Private Securities Litigation Reform Act of 1995. Words such as “believes,” “forecasts,” “intends,” “possible,” “expects,” “estimates,” “anticipates,” or “plans” and similar expressions are intended to identify forward-looking statements. Among the important factors on which such statements are based are assumptions concerning the state of the United States economy and the local markets in which our portfolio companies operate, the state of the securities markets in which the securities of our portfolio companies could be traded, liquidity within the United States financial markets, and inflation. Forward-looking statements are also subject to the risks and uncertainties described under the caption “Risk Factors” contained in Part I, Item 1A. of this Annual Report.

There may be other factors not identified that affect the accuracy of our forward-looking statements. Further, any forward-looking statement speaks only as of the date when it is made and, except as required by law, we undertake no obligation to update any forward-looking statement to reflect events or circumstances after the date on which it is made or to reflect the occurrence of anticipated or unanticipated events or circumstances. New factors emerge from time to time that may cause our business not to develop as we expect, and we cannot predict all of them.

Overview

Currently, we are an internally managed investment company that lends to and invests in small companies often concurrently with other investors. We have elected to be treated as a business development company (“BDC”) under the Investment Company Act of 1940, as amended (the “1940 Act”). As a BDC, we are required to comply with certain regulatory requirements. We have historically made the majority of our investments through our wholly-owned subsidiary, Rand Capital SBIC, Inc. (“Rand SBIC”), which operates as a small business investment company (“SBIC”) and has been licensed by the U.S. Small Business Administration (“SBA”) since 2002. Rand SBIC was approved for an additional $6.0 million in new SBA leverage commitments during 2018.

Our principal investment objective has historically been to achieve long-term capital appreciation on our equity investments while maintaining a current cash flow from our debenture and pass-through equity instruments to fund our operating expenses. Therefore, we invest in a variety of financial instruments to provide a current return on a portion of the investment portfolio. The equity features contained in our investment portfolio are structured to realize capital appreciation over the long-term and typically do not generate current income in the form of dividends or interest.

We have historically made initial investments of $500,000 to $1,000,000 directly in companies through equity or in debt or loan instruments and frequently provided follow-on investments during our investment tenure. The debt instruments generally have a maturity of not more than five years and usually have detachable equity warrants. Interest may be paid currently or deferred, based on the investment structure negotiated.


17


Table of Contents

We may exit investments through the maturation of a debt security or when a liquidity event takes place, such as the sale, recapitalization, or initial public offering of a portfolio company. The method and timing of the disposition of our portfolio investments can be critical to the realization of maximum total return. We generally expect to dispose of our equity securities through private sales of securities to other investors or through an outright sale of the portfolio company or a merger. We anticipate our debt investments will be repaid with interest and hope to realize further appreciation from the warrants or other equity type instruments we receive in connection with the investment. We fund new investments and operating expenses through existing cash balances, investment returns, and interest and principal payments from our portfolio companies

In January 2019, we entered into a stock purchase agreement to sell approximately 8.3 million shares of our common stock to East Asset Management, LLC (“East”) for $25 million in cash and portfolio assets. The portfolio assets will be income-producing instruments that were originated in the last 48 months. Additionally, a new entity, Rand Capital Management, LLC (“RCM”), will be established as an external management company and will be retained by Rand Capital to be its investment advisor. RCM will have the same management team that is currently at Rand. The sale and issuance of common stock pursuant to the stock purchase agreement as well as the externalization of the management structure are subject to shareholder and other regulatory approvals.

Following the closing of the above-described transactions ( the “Transactions”) and contingent upon meeting certain tax-related conditions, we intend to elect to become a regulated investment company (“RIC”) for U.S. federal tax purposes. This will enable the pass through of capital gains and investment income to shareholders without payment of corporate-level U.S. federal income tax by Rand.

2018 Portfolio and Investment Activity

We believe the change in net asset value over time is the leading valuation metric of our performance. Exits from our portfolio holdings are the key driver of growth in net asset value over time.


Net asset value of our portfolio decreased to $4.99 per share, or $31.5 million, at December 31, 2018, down ($0.06) per share, or (1.2%), compared with net asset value of $5.05 per share, or $31.9 million, at the end of the prior year.


At year end, the estimated value of our portfolio, which included investments in securities from 30 active companies, was $34.7 million. This value included $3.6 million in net pre-tax unrealized depreciation.


Approximately 59% of the portfolio was equity investments with the remainder being debt and loan investments.


The portfolio generated approximately $2.1 million in interest, fee, dividend and other income in 2018.


During 2018, we made $2.5 million of new investments in 8 companies, of which one was a new portfolio company.

Outlook

At the end of 2018, we had $4.0 million in cash available for future investments and expenses, a decrease from $6.3 million at the end of 2017. The decrease was primarily due to $2.5 million of investments originated during 2018 as well as funding ongoing operating expenses.

We received SBA approval during 2018 for an additional $6.0 million in leverage and we drew down $750,000 of that leverage as of December 31, 2018 and an additional $2,250,000 in January 2019.

We believe the combination of cash on hand, proceeds from portfolio exits, SBA leverage, and prospective investment income provide sufficient capital for us to continue to add new investments to our


18


Table of Contents

portfolio while reinvesting in existing portfolio companies that demonstrate continued growth potential. Additionally, upon the anticipated closing of the Transactions described above, we will have additional investments in our portfolio and additional cash to invest. The following short and long-term trends provide us confidence in our ability to grow Rand:


We expect that well run businesses will require capital to grow and should be able to compete effectively given the strong macroeconomic environment and eager reception of new technologies and service concepts.


We continue to manage risk by investing with other investors, when possible.


We are involved with the governance and management of a majority of our portfolio companies, which enables us to support their operating and marketing efforts and facilitate their growth.


As our portfolio expands, we are able to better leverage our infrastructure.


We have sufficient cash to invest in new opportunities and to repurchase shares. At year end, we had authorization to repurchase an additional 458,954 shares of our Common Stock. However, our prioritized use of cash continues to be growing our portfolio.


We believe the anticipated receipt of cash and portfolio assets from East, as well as the establishment of RCM as an external management company, will broaden our potential pipeline of investment opportunities in order to build our portfolio and grow further. Strategically, we expect to advance our efforts to increase our income producing investments that can support a regular cash dividend for shareholders and complement our equity investments that drive capital appreciation.

Critical Accounting Policies

We prepare our consolidated financial statements in accordance with United States generally accepted accounting principles, or GAAP, which require the use of estimates and assumptions that affect the reported amounts of assets and liabilities. For a summary of all significant accounting policies, including critical accounting policies, see Note 1 to the consolidated financial statements in Item 8 of this Annual Report.

The increasing complexity of the business environment and applicable authoritative accounting guidance require us to monitor our accounting policies and procedures. We have two critical accounting policies that require the use of significant judgment. The following summary of critical accounting policies is intended to enhance a reader’s ability to assess our financial condition and results of operations and the potential volatility due to changes in estimates.

Valuation of Investments

Investments are valued at fair value as determined in good faith by management and approved by our Board of Directors. We invest in loan, debt, and equity instruments and there is no single standard for determining fair value of these investments. As a result, determining fair value requires that judgment be applied to the specific facts and circumstances of each portfolio company while employing a consistent valuation process. We analyze and value each investment quarterly, and record unrealized depreciation for an investment that we believe has become impaired, including where collection of a loan or realization of the recorded value of an equity security is doubtful. Conversely, we will record unrealized appreciation if we believe that an underlying portfolio company has appreciated in value and, therefore, its equity security has also appreciated in value. These estimated fair values may differ from the values that would have been used had a ready market for the investments existed and these differences could be material if our assumptions and judgments differ from results of actual liquidation events.

Our investments are carried at fair value in accordance with Accounting Standards Codification (ASC) 820, “Fair Value Measurements and Disclosures”, which defines fair value, establishes a framework for measuring fair value in accordance with GAAP, and expands disclosures about fair value measurements.


19


Table of Contents

Loan investments are defined as traditional loan financings with no equity features. Debt investments are defined as debt financings that include one or more equity features such as conversion rights, stock purchase warrants, and/or stock purchase options. A financing may also be categorized as a debt financing if it is accompanied by the direct purchase of an equity interest in the portfolio company.

We utilize several approaches to determine the fair value of an investment. The main approaches are:


Loan and debt securities are valued at cost when it is representative of the fair value of the investment or sufficient assets or liquidation proceeds are expected to exist from a sale of a portfolio company at its estimated fair value. However, they may be valued at an amount other than cost given the carrying interest rate versus the related inherent portfolio risk of the investment. A loan or debt instrument may be reduced in value if it is judged to be of poor quality, collection is in doubt or insufficient liquidation proceeds exist.


Equity securities may be valued using the “asset approach”, “market approach” or “income approach.” The asset approach involves estimating the liquidation value of the portfolio company’s assets. This approach values the equity at the value remaining after the portfolio company pays of its debt and loan balances and its outstanding liabilities. The market approach uses observable prices and other relevant information generated by similar market transactions. It may include the use of market multiples derived from a set of comparables to assist in pricing the investment. Additionally, we adjust valuations if a subsequent significant equity financing has occurred that includes a meaningful portion of the financing by a sophisticated, unrelated new investor. The income approach employs a cash flow and discounting methodology to value an investment.

ASC 820 classifies the inputs used to measure fair value into the following hierarchy:

Level 1: Quoted prices in active markets for identical assets or liabilities, used in our valuation at the measurement date.

Level 2: Quoted prices for similar assets or liabilities in active markets, or quoted prices for identical or similar assets or liabilities in markets that are not active, or other observable inputs other than quoted prices.

Level 3: Unobservable and significant inputs to determining the fair value.

Financial assets are categorized based upon the level of judgment associated with the inputs used to measure their fair value.

Any changes in estimated fair value are recorded in the statement of operations as “Net change in unrealized depreciation on investments.”

Under the valuation policy, we value unrestricted publicly traded companies, categorized as Level 1 investments, at the average closing bid price for the last three trading days of the reporting period. There were no Level 1 or Level 2 investments as of December 31, 2018.

In the valuation process, we value restricted securities, categorized as Level 3 investments, using information from these portfolio companies, which may include:


Audited and unaudited statements of operations, balance sheets and operating budgets;


Current and projected financial, operational and technological developments of the portfolio company;


Current and projected ability of the portfolio company to service its debt obligations;


20


Table of Contents
   

The current capital structure of the business and the seniority of the various classes of equity if a deemed liquidation event were to occur;


Pending debt or capital restructuring of the portfolio company;


Current information regarding any offers to purchase the investment, or recent fundraising transactions;


Current ability of the portfolio company to raise additional financing if needed;


Changes in the economic environment which may have a material impact on the operating results of the portfolio company;


Internal circumstances and events that may have an impact (both positive and negative) on the operating performance of the portfolio company;


Qualitative assessment of key management;


Contractual rights, obligations or restrictions associated with the investment; and


Other factors deemed relevant by our management to assess valuation.

The valuation may be reduced if a portfolio company’s performance and potential have deteriorated significantly. If the factors that led to a reduction in valuation are overcome, the valuation may be readjusted.

Equity Securities

Equity Securities may include preferred stock, common stock, warrants and limited liability company membership interests.

The significant unobservable inputs used in the fair value measurement of our equity investments are earnings before interest, taxes and depreciation and amortization (EBITDA) and revenue multiples, where applicable, the financial and operational performance of the business, and the senior equity preferences that may exist in a deemed liquidation event. Standard industry multiples may be used when available; however, our portfolio companies are typically small and in early stages of development and these industry standards may be adjusted to more closely match the specific financial and operational performance of the portfolio company. Due to the nature of certain investments, fair value measurements may be based on other criteria, which may include third party appraisals. Significant changes to the unobservable inputs, such as variances in financial performance from expectations, may result in a significantly higher or lower fair value measurement. Significant changes in any of these unobservable inputs may result in a significantly higher or lower fair value estimate.

Another key factor used in valuing equity investments is a significant recent arms-length equity transaction with a sophisticated non-strategic unrelated new investor entered into by the portfolio company. The terms of these equity transactions may not be identical to the equity transactions between the portfolio company and us, and the impact of the difference in transaction terms on the market value of the portfolio company may be difficult or impossible to quantify.

When appropriate the Black-Scholes pricing model is used to estimate the fair value of warrants for accounting purposes. This model requires the use of highly subjective inputs including expected volatility and expected life, in addition to variables for the valuation of minority equity positions in small private and early stage companies. Significant changes in any of these unobservable inputs may result in a significantly higher or lower fair value estimate.

For recent investments, we generally rely on the cost basis, which is deemed to represent fair value, unless other fair market value inputs are identified causing us to depart from this basis.

Loans and Debt Securities

The significant unobservable inputs used in the fair value measurement of our loan and debt securities are the financial and operational performance of the portfolio company, similar debt with similar terms with other portfolio


21


Table of Contents

companies, current market rates for underlying risks associated with the particular company, as well as the market acceptance of the portfolio company’s products or services and its future performance. These inputs will likely provide an indicator as to the probability of principal recovery of the investment. Our debt investments are often junior secured or unsecured debt securities. Fair value may also be determined based on other criteria where appropriate. Significant changes to the unobservable inputs may result in a change in fair value.

For recent investments, we generally rely on the cost basis, which is deemed to represent the fair value, unless other fair market value inputs are identified causing us to depart from this basis.

Revenue Recognition

Interest income generally is recognized on the accrual basis except where the investment is in default or otherwise presumed to be in doubt. In such cases, interest income is recognized at the time of receipt. A reserve for possible losses on interest receivable is maintained when appropriate.

Our SBIC’s interest accrual is also regulated by the SBA’s “Accounting Standards and Financial Reporting Requirements for Small Business Investment Companies.” Under these rules, interest income cannot be recognized if collection is doubtful, and a 100% reserve must be established. The collection of interest is presumed to be in doubt when there is substantial doubt about a portfolio company’s ability to continue as a going concern or the loan is in default more than 120 days. Management also uses other qualitative and quantitative measures to determine the value of a portfolio investment and the collectability of any accrued interest.

We hold debt securities in our investment portfolio that contain payment-in-kind (“PIK”) interest provisions. PIK interest, computed at the contractual rate specified in each debt agreement, is periodically added to the principal balance of the debt and is recorded as interest income. Thus, the actual collection of this interest may be deferred until the time of debt principal repayment.

We may receive distributions from portfolio companies that are limited liability companies or corporations. These distributions are classified as dividend income on the consolidated statement of operations. Dividend income is recognized on an accrual basis when it can be reasonably estimated.

We hold preferred equity securities that may contain cumulative dividend provisions. Cumulative dividends are recorded as dividend income when they are declared and deemed a contractual obligation. Any dividends in arrears are added to the balance of the preferred equity investment. The actual collection of these dividends in arrears may be deferred until such time as the preferred security is redeemed.


22


Table of Contents

Financial Condition


     12/31/18      12/31/17      Increase
(Decrease)
    % Increase
(Decrease)
 

Overview:


Total assets

   $ 40,521,724      $ 40,133,913      $ 387,811       1.0

Total liabilities

     8,997,537        8,215,228        782,309       9.5


Net assets

   $ 31,524,187      $ 31,918,685      ($ 394,498     (1.2 %) 


Net asset value was $4.99 per share at December 31, 2018 versus $5.05 per share at December 31, 2017.

The outstanding SBA debentures at December 31, 2018 and 2017 are $8,750,000 and $8,000,000, respectively. The debentures mature from 2022 through 2029.

Cash approximated 13% of net assets at December 31, 2018 compared to 20% at December 31, 2017.

Composition of the Investment Portfolio

Our financial condition is dependent on the success of our portfolio holdings, which are investments in small companies. The following summarizes our investment portfolio at the year ends indicated.


     12/31/18      12/31/17      Change      % Change  

Investments, at cost

   $ 38,292,143      $ 36,689,319      $ 1,602,824        4.4

Unrealized depreciation, net

     (3,625,339      (4,405,257      779,918        (17.7 %) 


Investments, at fair value

   $ 34,666,804      $ 32,284,062      $ 2,382,742        7.4


Number of Active Portfolio Companies

     30        30        

Our total investments at fair value, as estimated by management and approved by the Board of Directors, approximated 110% of net assets at December 31, 2018 and 101% of net assets at December 31, 2017.

The change in investments, at cost, during the year ended December 31, 2018, is comprised of the following:


     Cost
Increase (Decrease)
 

New investments:


KnowledgeVision Systems, Inc. (Knowledgevision)

   $ 775,000  

Tech 2000, Inc. (Tech 2000)

     600,000  

BeetNPath, LLC (Beetnpath)

     262,627  

Genicon Inc. (Genicon)

     250,000  

SciAps, Inc. (Sciaps)

     250,000  

Centivo Corporation (Centivo)

     200,000  

Tilson Technology Management, Inc. (Tilson)

     100,000  

Empire Genomics, LLC (Empire Genomics)

     50,000  


Total of new investments

     2,487,627  

Other changes to investments:


Empire Genomics capitalized fee income and interest conversion

     298,287  

Genicon interest conversion and OID amortization

     231,807  

OnCore Golf Technology, Inc. (Oncore) interest conversion

     77,712  

Microcision LLC (Microcision) interest conversion

     19,213  

Tech 2000 interest conversion

     10,777  

GoNoodle, Inc. (GoNoodle) interest conversion

     10,333  

Centivo interest conversion

     1,342  


Total of other changes to investments

     649,471  


23


Table of Contents

Investments repaid, sold or liquidated:


Intrinsiq Material, Inc. (Intrinsiq) realized loss

     (1,125,673

First Wave Technologies, Inc. (First Wave) realized loss

     (338,469

Knoa Software Inc. (Knoa) repayment

     (48,466

Empire Genomics repayment

     (21,667


Total of investments repaid, sold or liquidated

     (1,534,274


Net change in investments, at cost

   $ 1,602,824  


Our top five portfolio companies represented 39% of total assets at December 31, 2018:


Company


Industry

   Fair Value at
December 31,
2018
     % of Total
Assets at
December 31,

2018
 

Genicon, Inc.

   Health Care – Testing Device    $ 4,423,086        11

eHealth Global Technologies, Inc.

   Health Care    $ 3,500,000        9

ACV Auctions, Inc.

   Software    $ 2,776,907        7

Tilson Technology Management, Inc.

   Professional Services    $ 2,600,000        6

Microcision, LLC

   Manufacturing    $ 2,543,353        6

Our top five portfolio companies represented 37% of total assets at December 31, 2017:


Company


Industry

   Fair Value at
December 31,
2017
     % of Total
Assets at
December 31,

2017
 

Genicon, Inc.

   Health Care – Testing Device    $ 4,023,779        10

eHealth Global Technologies, Inc.

   Health Care    $ 3,500,000        9

Rheonix, Inc.

   Health Care – Testing Device    $ 2,938,731        7

Tilson Technology Management, Inc.

   Professional Services    $ 2,500,000        6

Outmatch Holdings, LLC

   Software    $ 2,145,496        5


  Below

is the geographic breakdown of our investments at fair value as of December 31, 2018 and 2017:


Geographic Region

   % of Net Asset Value
at December 31, 2018
    % of Net Asset Value
at December 31, 2017
 

USA – East

     94     86

USA - South

     16     15


Total investments as a % of net asset value

     110     101


24


Table of Contents

As of December 31, 2018 and 2017, the investment portfolio consisted of the following types of investments:


     Cost      Percentage of
Total
Portfolio
    Fair Value      Percentage
of Total
Portfolio
 

December 31, 2018:


Subordinated Debt and Promissory Notes

   $ 14,017,541        36   $ 13,296,948        38

Convertible Debt

     1,866,615        5       1,036,808        3  

Equity and Membership Interests

     22,155,337        58       20,260,523        59  

Equity Warrants

     252,650        1       72,525        0  


Total

   $ 38,292,143        100   $ 34,666,804        100


December 31, 2017:


Subordinated Debt and Promissory Notes

   $ 12,924,321        35   $ 11,796,289        37

Convertible Debt

     1,849,955        5       1,849,955        6  

Equity and Membership Interests

     21,640,393        59       18,482,793        57  

Equity Warrants

     274,650        1       155,025        0  


Total

   $ 36,689,319        100   $ 32,284,062        100


25


Table of Contents

Results of Operations

Investment Income

Our principal investment objective is to achieve long-term capital appreciation on our equity investments while maintaining a current cash flow from our debenture and pass-through equity instruments to fund expenses. Therefore, we invest in a variety of financial instruments to provide a current return on a portion of the investment portfolio.

Comparison of the years ended December 31, 2018 and 2017


     December 31,
2018
     December 31,
2017
     Increase      % Increase  

Interest from portfolio companies

   $ 1,498,740      $ 1,155,316      $ 343,424        30

Interest from other investments

     37,614        30,761        6,853        22

Dividend and other investment income

     384,382        243,614        140,768        58

Fee income

     186,218        25,091        161,127        642


Total investment income

   $ 2,106,954      $ 1,454,782      $ 652,172        45


Investment income increased 45%, or $652,172, from $1,454,782 for the year ended December 31, 2017 to $2,106,954 for the year ended December 31, 2018. The total investment income that is received on a current basis for the year ended December 31, 2018 is received from 9 portfolio companies. This contrasts with the 11 portfolio companies generating current income for the year ended December 31, 2017.    

Interest from portfolio companies – Interest from portfolio companies was approximately 30% higher during the year ended December 31, 2018 versus the same period in 2017 due to the fact that we have originated more income-producing debt investments in the last year. The new debt instruments were originated from KnowledgeVision Systems, Inc. (Knowledgevision), Tech 2000, Inc. (Tech 2000), Genicon Inc. (Genicon) and several other portfolio companies. In addition, during 2018 the Empire Genomics loans were modified and resulted in a recording of interest that had previously not been accrued of approximately $91,000. This amount was capitalized into the loan balance as part of the debt modification and is non-recurring.    

The following investments are on non-accrual status: G-TEC Natural Gas Systems (G-Tec) and a portion of the Mercantile Adjustment Bureau, LLC (Mercantile) outstanding loan balances.

Interest from other investments - The increase in interest from other investments was primarily due to higher average cash balances during the year ended December 31, 2018 versus the year ended December 31, 2017.

Dividend and other investment income - Dividend income is comprised of cash distributions from limited liability companies (LLCs) and corporations in which we have invested. Our investment agreements with certain LLCs require those LLCs to distribute funds to us for payment of income taxes on our allocable share of the LLC’s profits. These portfolio companies may also elect to make additional discretionary distributions. Dividend income will fluctuate based upon the profitability of these LLCs and corporations and the timing of the distributions or the impact of new investments or divestitures. The dividend distributions for the respective periods were:


     December 31, 2018      December 31, 2017  

Carolina Skiff LLC (Carolina Skiff)

   $ 251,913      $ 178,532  

Advantage 24/7 LLC (Advantage 24/7)

     60,000        —    

Tilson Technology Management, Inc. (Tilson)

     39,002        21,579  

New Monarch Machine Tool, LLC (Monarch)

     27,409        27,409  

Empire Genomics, LLC (Empire Genomics)

     6,058        10,070  

SOMS Technologies, LLC (SOMS)

     —          6,024  


Total dividend and other investment income

   $ 384,382      $ 243,614  


26


Table of Contents

Fee income – Fee income typically consists of the revenue associated with the amortization of financing fees charged to the portfolio companies upon successful closing of SBIC financings and income from portfolio company board attendance fees. The financing fees are amortized ratably over the life of the instrument associated with the fees. The unamortized fees are carried on the balance sheet under the line item “Deferred revenue.”

The income associated with the amortization of financing fees was $41,872 and $24,091 for the years ended December 31, 2018 and 2017, respectively. The financing fee income based on the existing portfolio is expected to be approximately $46,000 in 2019, $21,000 in 2020 and $6,000 in 2021.

Fees paid for board service at the portfolio companies were $2,000 and $1,000 for the years ended December 31, 2018 and 2017, respectively.

In addition, we recorded a one-time debt modification fee of approximately $142,000 from Empire Genomics which was capitalized into the Empire Genomics loan balances as part of the debt modification.

Comparison of the years ended December 31, 2017 and 2016


     December 31,
2017
     December 31,
2016
     Increase
(Decrease)
    % Increase
(Decrease)
 

Interest from portfolio companies

   $ 1,155,316      $ 767,153      $ 388,163       51

Interest from other investments

     30,761        45,139        (14,378     (32 %) 

Dividend and other investment income

     243,614        192,932        50,682       26

Fee income

     25,091        26,634        (1,543     (6 %) 


Total investment income

   $ 1,454,782      $ 1,031,858      $ 422,924       41


Investment income increased 41%, or $422,924, from $1,031,858 for the year ended December 31, 2016 to $1,454,782 for the year ended December 31, 2017.

Interest from portfolio companies – Interest from portfolio companies was 51% higher during the year ended December 31, 2017 versus the same period in 2016 due to the fact that more income-producing debt investments were originated in the last year. These new debt instruments were originated from Genicon Inc. (Genicon), eHealth Global Technologies, Inc. (eHealth), Empire Genomics, LLC (Empire Genomics) and several other portfolio companies.

The following investments were on non-accrual status at December 31, 2017: G-TEC Natural Gas Systems (G-Tec), First Wave Products Group, LLC (First Wave) and a portion of the Mercantile Adjustment Bureau, LLC (Mercantile) outstanding loan balance.

Interest from other investments – The decrease in interest from other investments was primarily due to lower average cash balances during the year ended December 31, 2017 versus the year ended December 31, 2016.


27


Table of Contents

Dividend and other investment income – The dividend distributions for the respective periods were:


     December 31,
2017
     December 31,
2016
 

Carolina Skiff LLC (Carolina Skiff)

   $ 178,532      $ 131,785  

New Monarch Machine Tool, LLC (Monarch)

     27,409        27,409  

Tilson Technology Management, Inc. (Tilson)

     21,579        16,250  

Empire Genomics, LLC (Empire Genomics)

     10,070        4,024  

SOMS Technologies, LLC (SOMS)

     6,024        13,464  


Total dividend and other investment income

   $ 243,614      $ 192,932  


Fee income - The income associated with the amortization of financing fees was $24,091 and $22,634 for the years ended December 31, 2017 and 2016, respectively. The financing fee income based on the existing portfolio is expected to be approximately $21,000 in 2018, $15,000 in 2019 and $2,000 in 2020.

Fees paid for board service at the portfolio companies were $1,000 and $4,000 for the years ended December 31, 2017 and 2016, respectively.

Expenses

Comparison of the years ended December 31, 2018 and 2017


     December 31,
2018
     December 31,
2017
     Increase      % Increase  

Total expenses

   $ 2,193,672      $ 2,010,977      $ 182,695        9

Expenses predominately consist of interest expense on outstanding SBA borrowings, compensation expense, and general and administrative expenses, including stockholder and office operating expenses and professional fees.

The increase in expenses during the year ended December 31, 2018 versus the same period in 2017 was primarily caused by a 14%, or approximately $50,000, increase in professional fees. Professional fees are higher during 2018 primarily as a result of expenses incurred in the consideration of strategic alternatives. These expenses included external legal, tax consulting and other advisory expenses to support analysis of our strategic alternatives, which involved assessing options relative to the complex regulatory environment in which we operate.

In addition bonus and profit sharing expense went from $12,000 during the year ended December 31, 2017 to $125,000 during the year ended December 31, 2018, an $113,000 increase.

Comparison of the years ended December 31, 2017 and 2016


     December 31,
2017
     December 31,
2016
     Decrease     % Decrease  

Total expenses

   $ 2,010,977      $ 3,401,037      ($ 1,390,060     (41 %) 

The decrease in expenses during the year ended December 31, 2017 versus the same period in 2016 was primarily caused by a decrease of $1,373,052 in bonus and profit sharing expense related to the Gemcor II, LLC (Gemcor) exit in early 2016. Gemcor sold its assets in March 2016 and based on our ownership percentage, we received gross cash proceeds of approximately $13.8 million, excluding an escrow receivable, and realized a gain, before income taxes, of approximately $13.2 million from the sale. As a result of this sale, we recognized $1,385,052 under our Profit Sharing Plan during the year ended December 31, 2016. There were no amounts earned pursuant to the Profit Sharing Plan for the year ended December 31, 2017.

Net Realized Gains and Losses on Investments


     December 31,
2018
     December 31,
2017
     December 31,
2016
 

Net realized (loss) gain on sales and dispositions, before income tax (benefit) expense

   ($ 1,464,142    $ 138,240      $ 14,138,203  


28


Table of Contents

During the year ended December 31, 2018, we recognized a realized loss of $1,125,673 on our investment in Intrinsiq Material, Inc. (Intrinsiq) when the company was sold and we did not receive any proceeds. In addition we restructured our notes in First Wave Technologies, Inc. (First Wave) and converted the notes into equity. As part of that restructuring we recognized a realized loss of $338,469 on the junior note and the warrants.

During the year ended December 31, 2017, one of our portfolio companies, Athenex Inc. (Athenex) completed an initial public offering and its common stock became publicly traded on the Nasdaq Global Select Market under the symbol “ATNX”. We sold our shares in Athenex and recognized a net realized gain, before income taxes, of $638,240 on the sale of the 46,296 Athenex shares.

In addition, during 2017, we recognized a realized loss of $500,000 on our investment in City Dining Cards (Loupe) when the company ceased operations.

During 2016 our portfolio company, Gemcor II, LLC, sold its assets, and we received gross cash proceeds of approximately $14.1 million, excluding amounts held in escrow, and recognized a realized gain, before income taxes, of $14,620,063. The escrow holdback at December 31, 2016 was $1,100,000. The escrow was released, in full, during 2017.

In addition, we recognized a realized gain of $168,140 during the year ended December 31, 2016 from the earn out provision in connection with the 2014 sale of QuaDPharma, LLC to Athenex Inc. We recognized a realized loss of $650,000 on our investment in Statisfy, Inc. (Statisfy) during the year ended December 31, 2016 when the company ceased operations.

Net Change in Unrealized Depreciation on Investments

The change in unrealized depreciation, before income taxes, for the year ended December 31, 2018 was comprised of the following:


     Year ended
December 31, 2018
 

Empire Genomics, LLC (Empire Genomics)

   ($ 901,360

Rheonix, Inc. (Rheonix)

     (735,999

SOMS Technologies, LLC (SOMS)

     (528,348

BeetNPath, LLC (Beetnpath)

     (388,723

KnowledgeVision Systems, Inc. (Knowledgevision)

     (300,000

Mercantile Adjustment Bureau, LLC (Mercantile)

     (249,040

G-Tec Natural Gas Systems (Gtec)

     (100,000

Genicon, Inc. (Genicon)

     (82,500

OnCore Golf Technology, Inc. (Oncore)

     (77,712

First Wave Products Group (First Wave)

     121,469  

GiveGab, Inc. (Givegab)

     191,907  

Microcision LLC (Microcision)

     610,000  

Intrinsiq Material, Inc. (Intrinsiq) reclassed to a realized loss

     725,673  

ACV Auctions, Inc. (ACV)

     2,494,551  


Total change in net unrealized depreciation of investments before income taxes during the year ended December 31, 2018

   $ 779,918  


29


Table of Contents

The valuations of our investments in Beetnpath, Empire Genomics, Gtec, Mercantile, Oncore, Rheonix, and SOMS were decreased after we reviewed each of the portfolio company’s operations, commercial progress against their business plan, and past and projected financial condition and determined that a valuation adjustment was necessary.

Our valuation of First Wave was changed to reflect a conversion from debt instruments to equity holdings. As part of this restructure we recognized a realized loss on the junior note and the warrants.

Givegab’s value was increased to the cost basis of the investment after a financial analysis of the portfolio company indicating continued improved performance.

Our valuation of Knowledgevision and Genicon were decreased during the year ended December 31, 2018 to revalue our holdings based upon liquidation preferences of our securities and on a recent round of financing.

In accordance with our valuation policy, we increased the value of our holdings in ACV and Microcision. ACV was increased based on a significant equity financing during 2018 with sophisticated new non-strategic outside investors at a higher valuation than their prior financing round valuation. Microcision was increased based on a financial analysis of the company indicating positive cash flow from operations for the past two years.

The Intrinsiq investment was written off after the company was sold during 2018 and we did not receive any proceeds.

The change in unrealized depreciation, before income taxes, for the year ended December 31, 2017 was comprised of the following:


     Year ended
December 31, 2017
 

SciAps, Inc. (Sciaps)

   ($ 554,710

Teleservices Solutions Holdings, LLC (Teleservices)

     (395,398

Intrinsiq Materials, Inc. (Intrinsiq)

     (380,000

Athenex, Inc. (Athenex) reclass to a realized gain

     (273,379

Mercantile Adjustment Bureau, LLC (Mercantile)

     (250,000

BeetNPath, LLC (Beetnpath)

     29,723  

ACV Auctions, Inc. (ACV)

     119,356  

Carolina Skiff LLC (Carolina Skiff)

     650,000  

Knoa Software, Inc. (Knoa)

     779,700  


Total change in net unrealized depreciation on investments before income taxes during the year ended December 31, 2017

   ($ 274,708


The valuations of our investments in Intrinsiq, Mercantile and Teleservices were decreased after we reviewed each portfolio company and its current and projected financial condition and determined that a valuation adjustment was necessary.

In accordance with our valuation policy, we adjusted the value of our investments in ACV, Beetnpath and Sciaps based on a significant equity financing by a new non-strategic outside entity, and consideration of the related affect on the liquidation preferences of our existing investment instrument in each of the companies. In addition, our investments in Carolina Skiff and Knoa were increased based on a financial analysis of each portfolio company indicating improved performance.


30


Table of Contents

The change in net unrealized depreciation, before income taxes, for the year ended December 31, 2016 was comprised of the following:


     Year ended
December 31,

2016
 

Gemcor II, LLC (Gemcor) reclassed to a realized gain

   ($ 12,775,000

Teleservices Solutions Holdings, LLC (Teleservices)

     (990,680

Knoa Software, Inc. (Knoa)

     (422,800

OnCore Golf Technology, Inc. (Oncore)

     (187,500

Athenex, Inc. (Athenex)

     69,444  

Intrinsiq Materials, Inc. (Intrinsiq)

     254,329  

Carolina Skiff LLC (Carolina Skiff)

     500,000  


Total change in net unrealized depreciation of investments before income taxes during the year ended December 31, 2016

   ($ 13,552,207


During the first quarter of 2016 Gemcor II, LLC sold its assets and we received gross cash proceeds of approximately $14.1 million. The realized gain from the sale, before income taxes, was $14,620,063 and included $1,100,000 that was held in escrow at December 31, 2016.

Our investment in Teleservices was revalued after we reviewed their operations and their current and past financial performance. This review indicated that a further deterioration of their business had occurred. The portfolio company remains in operation and is developing new business strategies.

The valuation of our investment in Knoa was decreased during 2016 to value our equity at liquidation value. The valuation of our investment in Oncore was decreased after we reviewed the portfolio company and its financial condition and determined that a valuation adjustment was necessary.

In accordance with our valuation policy, we increased the value of our investment in Athenex based on a significant equity financing by a new non-strategic outside entity. This new financing used a higher valuation for Athenex than had been used for its prior financing rounds.

Intrinsiq’s value was increased based on the completion of an equity refinancing in the third quarter of 2016. Carolina Skiff’s value was increased based on a financial analysis of the portfolio company indicating continued improved performance.

All of these value adjustments resulted from a review by management using the guidance set forth by ASC 820 and our established valuation policy.

Net Decrease in Net Assets from Operations

We account for our operations under GAAP for investment companies. The principal measure of our financial performance is “Net decrease in net assets from operations” on our consolidated statements of operations. During the year ended December 31, 2018, the net decrease in net assets from operations was ($394,498) as compared with net decreases of ($710,678) in 2017 and ($1,202,683) in 2016.

Liquidity and Capital Resources

Historically, our principle objective has been to achieve capital appreciation. Therefore, a significant portion of the investment portfolio is structured to maximize the potential for capital appreciation and may provide little or no current yield in the form of dividends or interest payments. As discussed above, on the closing of the Transactions contemplated by the Stock Purchase Agreement with East, we expect to receive interest bearing investments and subsequently to position the portfolio to earn a current yield.


31


Table of Contents

As of December 31, 2018, our total liquidity consisted of $4,033,792 in cash and cash equivalents. In addition we had an outstanding SBA leverage commitment of $5,250,000 at December 31, 2018.

Net cash used by operating activities has averaged approximately $820,000 over the last three years. The cash used for investments in portfolio companies has averaged approximately $4,600,000 over the last three years. Our cash flow may fluctuate based on the timing of the receipt of dividend income, realized exits and the associated income taxes paid. We will generally use cash to fund our operating expenses and to invest in companies as we build our portfolio. We anticipate that we will continue to exit investments. However, the timing of liquidation events within the portfolio is difficult to project. Starting in 2022 (See Note 5. in the Notes to the Consolidated Financial Statements), our outstanding SBA debt begins to reach maturity and this will require us to identify sources of future funding if liquidation of investments is not sufficient to fund operations and repay the SBA debt obligation.

The following table summarizes the SBA leverage at the year ends indicated:


     December 31, 2018      December 31, 2017  

Outstanding SBA leverage

   $ 8,750,000      $ 8,000,000  

Outstanding SBA commitment

   $ 5,250,000      $ 0  

The following table summarizes the cash estimated to be received over the next five years from existing portfolio companies based on contractual obligations as of December 31, 2018. These payments represent scheduled principal and interest payments that are due under the terms of the investment securities we own in each portfolio company and are subject to change based on factors such as conversions and restructurings. It does not include any equity investments, which may provide additional proceeds upon exit of the investment.


     Cash Receipts due by year  
     2019      2020      2021      2022      2023 and
beyond
 

Scheduled cash receipts from portfolio companies

   $ 1,507,000      $ 12,709,000      $ 2,026,000      $ 1,100,000      $ 2,500,000  

Number of companies contributing to the scheduled cash receipts

     10        10        4        2        1  

We believe that the cash on hand at December 31, 2018, the outstanding SBA leverage commitment and the scheduled interest payments on our portfolio investments will be sufficient to meet our cash needs throughout 2019. We continue to pursue potential exits from portfolio companies to increase the amount of liquidity available for new investments, operating activities and future SBA debenture obligations.

Contractual Obligations

The following table shows our specified contractual obligations at December 31, 2018. We do not have any capital lease obligations or other long-term liabilities reflected on our consolidated statement of financial position.     


     Payments due by period  
     Total      Less than
1 year
     1-3
years
     4-5
years
     More
than 5 yrs
 

SBA debentures

   $ 8,750,000      $ 0      $ 3,000,000      $ 4,000,000      $ 1,750,000  

SBA interest expense

   $ 1,706,000      $ 304,000      $ 943,000      $ 301,000      $ 158,000  

Operating lease obligations (Rent of office space)

   $ 39,180      $ 19,440      $ 19,740      $ 0      $ 0  


Total

   $ 10,495,180      $ 323,440      $ 3,962,740      $ 4,301,000      $ 1,908,000  


32


Table of Contents
Item 7A.

Quantitative and Qualitative Disclosures about Market Risk

Our investment activities contain elements of risk. The portion of our investment portfolio consisting of debt and equity securities in private companies is subject to valuation risk. Because there is typically no public market for the debt and equity securities in which we invest, the valuations of the debt and equity interests in the portfolio are stated at “fair value” as determined in good faith by our management and approved by our Board of Directors. This is in accordance with our investment valuation policy. (The discussion of valuation policy contained in “Note 1- Summary of Significant Accounting Policies - Investments” in the consolidated financial statements contained in Item 8 of this report is incorporated herein by reference.) In the absence of readily ascertainable market values, the estimated value of the portfolio may differ significantly from the values that would be placed on the portfolio if a ready market for the investments existed. Any changes in valuation are recorded on the consolidated statement of operations as “Net change in unrealized depreciation on investments.”

At times, a portion of our portfolio may include marketable securities traded in the over-the-counter market or on stock exchange. In addition, there may be a portion of the portfolio for which no regular trading market exists. In order to realize the full value of a security, the market must trade in an orderly fashion or a willing purchaser must be available when a sale is to be made. Should an economic or other event occur that would not allow markets to trade in an orderly fashion, we may not be able to realize the fair value of our marketable investments or other investments in a timely manner.

As of December 31, 2018, we did not have any off-balance sheet arrangements or hedging or similar derivative financial instrument investments.


33


Table of Contents
Item 8.

Financial Statements and Supplementary Data

The following consolidated financial statements and consolidated supplemental schedule of the Corporation and report of Independent Registered Public Accounting Firm thereon are set forth below:


Consolidated Statements of Financial Position as of December  31, 2018 and 2017

     35  

Consolidated Statements of Operations for the three years in the period ended December 31, 2018

     36  

Consolidated Statements of Changes in Net Assets for the three years in the period ended December 31, 2018

     37  

Consolidated Statements of Cash Flows for the three years in the period ended December 31, 2018

     38  

Consolidated Schedule of Portfolio Investments as of December  31, 2018

     39  

Consolidated Schedule of Portfolio Investments as of December  31, 2017

     47  

Financial Highlights Schedule for the five years in the period ended December 31, 2018

     55  

Notes to the Consolidated Financial Statements

     56  

Supplemental Schedule of Consolidated Changes in Investments at Cost and Realized Loss for the year ended December 31, 2018

     74  

Report of Independent Registered Public Accounting Firm

     75  


34


Table of Contents

RAND CAPITAL CORPORATION AND SUBSIDIARIES

CONSOLIDATED STATEMENTS OF FINANCIAL POSITION

December 31,


     2018     2017  

ASSETS


Investments at fair value:


Control investments (cost of $ 99,500)

   $ 99,500     $ 99,500  

Affiliate investments (cost of $20,708,659 and $20,871,129, respectively)

     17,026,091       17,016,795  

Non-Control/Non-Affiliate investments (cost of $17,483,984 and $15,718,690, respectively)

     17,541,213       15,167,767  


Total investments, at fair value (cost of $38,292,143 and $36,689,319, respectively)

     34,666,804       32,284,062  

Cash and cash equivalents

     4,033,792       6,262,039  

Interest receivable (net of allowance: $161,000)

     145,532       231,048  

Deferred tax asset

     525,198       551,863  

Prepaid income taxes

     1,138,708       762,047  

Other assets

     11,690       42,854  


Total assets

   $ 40,521,724     $ 40,133,913  


LIABILITIES AND STOCKHOLDERS’ EQUITY (NET ASSETS)


Liabilities:


Debentures guaranteed by the SBA (net of debt issuance costs)

   $ 8,554,443     $ 7,855,173  

Profit sharing and bonus payable

     125,000       144,000  

Accounts payable and accrued expenses

     245,758       178,348  

Deferred revenue

     72,336       37,707  


Total liabilities

     8,997,537       8,215,228  

Commitments and contingencies (See Note 9)


Stockholders’ equity (net assets):


Common stock, $0.10 par; shares authorized 10,000,000; shares issued 6,863,034; shares outstanding of 6,321,988 at 2018 and 2017

     686,304       686,304  

Capital in excess of par value

     10,581,789       10,581,789  

Accumulated net investment loss

     (1,665,552     (1,597,146

Undistributed net realized gain on investments

     26,221,443       27,215,738  

Net unrealized depreciation on investments

     (2,830,692     (3,498,895

Treasury stock, at cost: 541,046 shares

     (1,469,105     (1,469,105


Total stockholders’ equity (net assets) (per share 2018: $4.99, 2017: $5.05)

     31,524,187       31,918,685  


Total liabilities and stockholders’ equity (net assets)

   $ 40,521,724     $ 40,133,913  


See accompanying notes


35


Table of Contents

RAND CAPITAL CORPORATION AND SUBSIDIARIES

CONSOLIDATED STATEMENTS OF OPERATIONS

For The Years Ended December 31, 2018, 2017 and 2016


     2018     2017     2016  

Investment income:


Interest from portfolio companies:


Control investments

   $ —       $ —       $ 11,828  

Affiliate investments

     741,432       563,708       403,850  

Non-Control/Non-Affiliate investments

     757,308       591,608       351,475  


Total interest from portfolio companies

     1,498,740       1,155,316       767,153  

Interest from other investments:


Non-Control/Non-Affiliate investments

     37,614       30,761       45,139  


Total interest from other investments

     37,614       30,761       45,139  

Dividend and other investment income:


Control investments

     60,000       —         —    

Affiliate investments

     318,324       233,544       188,908  

Non-Control/Non-Affiliate investments

     6,058       10,070       4,024  


Total dividend and other investment income

     384,382       243,614       192,932  


Fee income:


Control investments

     —         —         2,000  

Affiliate investments

     15,667       8,416       5,862  

Non-Control/Non-Affiliate investments

     170,551       16,675       18,772  


Total fee income

     186,218       25,091       26,634  


Total investment income

     2,106,954       1,454,782       1,031,858  


Expenses:


Salaries

     679,499       661,650       621,749  

Profit sharing and bonuses

     125,000       12,000       1,385,052  

Employee benefits

     194,818       160,779       174,796  

Directors’ fees

     128,750       142,499       184,750  

Professional fees

     407,159       356,936       339,823  

Shareholders and office operating

     230,050       249,085       227,631  

Insurance

     34,187       31,876       32,134  

Corporate development

     62,117       65,202       64,412  

Other operating

     21,092       20,675       21,414  


     1,882,672       1,700,702       3,051,761  

Interest on SBA obligations

     311,000       310,275       310,276  

Bad debt expense

     —         —         39,000  


Total expenses

     2,193,672       2,010,977       3,401,037  


Investment loss before income taxes

     (86,718     (556,195     (2,369,179

Income tax benefit

     (18,312     (536,897     (815,911


Net investment loss

     (68,406     (19,298     (1,553,268


Net realized (loss) gain on sales and dispositions of investments:


Control investments

     —         —         14,620,063  

Affiliate investments

     (1,464,142     —         (650,000

Non-Control/Non-Affiliate investments

     —         138,240       168,140  


Net realized (loss) gain on sales and dispositions, before income taxes

     (1,464,142     138,240       14,138,203  

Income tax (benefit) expense

     (469,847     49,556       5,273,550  


Net realized (loss) gain on sales and dispositions of investments

     (994,295     88,684       8,864,653  

Net change in unrealized depreciation on investments:


Control investments

     —         —         (12,775,000

Affiliate investments

     608,207       129,315       (846,651

Non-Control/Non-Affiliate investments

     171,711       (404,023     69,444  


Change in unrealized depreciation before income taxes

     779,918       (274,708     (13,552,207

Deferred income tax expense (benefit)

     111,715       505,356       (5,038,139


Net change in unrealized depreciation or appreciation on investments

     668,203       (780,064     (8,514,068


Net realized and unrealized (loss) gain on investments

     (326,092     (691,380     350,585  


Net decrease in net assets from operations

   ($ 394,498   ($ 710,678   ($ 1,202,683


Weighted average shares outstanding

     6,321,988       6,321,988       6,325,792  

Basic and diluted net decrease in net assets from operations per share

     (0.06     (0.11     (0.19

See accompanying notes


36


Table of Contents

RAND CAPITAL CORPORATION AND SUBSIDIARIES

CONSOLIDATED STATEMENTS OF CHANGES IN NET ASSETS

For The Years Ended December 31, 2018, 2017 and 2016


     2018     2017     2016  

Net assets at beginning of year

   $ 31,918,685     $ 32,629,363     $ 33,853,660  

Net investment loss

     (68,406     (19,298     (1,553,268

Net realized (loss) gain on sales and dispositions of investments

     (994,295     88,684       8,864,653  

Net increase (decrease) in unrealized depreciation or appreciation on investments

     668,203       (780,064     (8,514,068


Net decrease in net assets from operations

     (394,498     (710,678     (1,202,683

Purchase of treasury stock

     —         —         (21,614


Total decrease in net assets

     (394,498     (710,678     (1,224,297


Net assets at end of year

   $ 31,524,187     $ 31,918,685     $ 32,629,363  


Accumulated net investment loss

   ($ 1,665,552   ($ 1,597,146   ($ 1,577,848


See accompanying notes.


37


Table of Contents

RAND CAPITAL CORPORATION AND SUBSIDIARIES

CONSOLIDATED STATEMENTS OF CASH FLOWS

For The Years Ended December 31, 2018, 2017 and 2016


     2018     2017     2016  

Cash flows from operating activities:


Net decrease in net assets from operations

   ($ 394,498   ($ 710,678   ($ 1,202,683

Adjustments to reconcile net decrease in net assets to net cash (used in) provided by operating activities:


Investments originated

     (2,487,627     (5,400,000     (5,883,012

Proceeds from sale of portfolio investments

     —         781,525       15,413,203  

Proceeds from loan repayments

     70,131       —         416,972  

Net realized loss (gain) on portfolio investments

     1,464,142       (138,240     (14,138,203

Change in unrealized depreciation on investments

     (779,918     274,708       13,552,207  

Deferred tax expense (benefit)

     26,665       613,301       (3,526,350

Depreciation and amortization

     29,686       31,433       33,390  

Original issue discount accretion

     (39,653     (32,129     (9,996

Change in interest receivable allowance

     —         —         39,000  

Non-cash conversion of debenture interest

     (609,817     (269,445     (19,252

Changes in operating assets and liabilities:


Decrease (increase) in interest receivable

     85,516       93,189       (148,013

Decrease in other assets

     28,936       1,101,621       450,752  

(Increase) decrease in prepaid income taxes

     (376,661     (762,047     65,228  

(Decrease) increase in income taxes payable

     —         (320,008     320,008  

(Decrease) increase in profit sharing and bonus payable

     (19,000     (1,126,052     988,052  

Increase (decrease) in accounts payable and accrued liabilities

     67,410       (146,189     85,626  

Increase (decrease) in deferred revenue

     34,629       (9,090     20,867  


Total adjustments

     (2,505,561     (5,307,423     7,660,479  


Net cash (used in) provided by operating activities

     (2,900,059     (6,018,101     6,457,796  

Cash flows from investing activities:


Capital expenditures

     —         —         (837


Net cash used in investing activities

     —         —         (837

Cash flows from financing activities:


Proceeds from SBA debentures

     750,000       —         —    

Origination costs to SBA

     (78,188     —         —    

Purchase of treasury shares

     —         —         (21,614


Net cash provided by (used in) financing activities

     671,812       —         (21,614


Net (decrease) increase in cash

     (2,228,247     (6,018,101     6,435,345  


Cash:


Beginning of year

     6,262,039       12,280,140       5,844,795  


End of year

   $ 4,033,792     $ 6,262,039     $ 12,280,140  


See accompanying notes


38


Table of Contents

RAND CAPITAL CORPORATION AND SUBSIDIARY

CONSOLIDATED SCHEDULE OF PORTFOLIO INVESTMENTS

December 31, 2018


Company, Geographic Location, Business

Description, (Industry) and Website          


(a)

                Type of Investment                


(b)

Date

  Acquired  


(c)

  Equity  

        Cost         

(d)(f)

Fair

  Value  


Percent

of Net

  Assets  

 
Non-Control/Non-Affiliate Investments – 55.7% of net assets: (j)                 
ACV Auctions, Inc. (e)(g)    1,181,160 Series A Preferred.      8/12/16        <1   $ 163,000      $ 2,776,907        8.8

Buffalo, NY. Live mobile wholesale auctions for new and used car dealers. (Software)

www.acvauctions.com

                
Centivo Corporation (e)(g)    190,967 Series A-1 Preferred.      7/5/17        <1     200,000        200,000        1.0

New York, NY. Tech-enabled health solutions company that helps self-insured employers and their employees save money and have a better experience. (Health Care)

www.centivo.com

   337,808 Series A-2 Preferred.           101,342        101,342     


   Total Centivo           301,342        301,342     


eHealth Global Technologies, Inc. (g)

Henrietta, NY. eHealth Connect® improves health care delivery through intelligently aggregated clinical record and images for patient referrals. (Health Care) www.ehealthtechnologies.com

   $3,500,000 Term Note at 13% due December 31, 2020.      6/28/16        0     3,500,000        3,500,000        11.1

Empire Genomics, LLC (g)(m)

Buffalo, NY. Molecular diagnostics company that offers a comprehensive menu of assay services for diagnosing and guiding patient therapeutic treatments. (Health Care) www.empiregenomics.com


$1,209,014 Senior Secured Convertible Term Notes at 10% (8% PIK through September 30, 2019) due December 31, 2020.

$444,915 Promissory Note at 9% (4% PIK) due December 31, 2020.

     6/13/14        0    


1,233,195


444,915


474,181


302,569


     2.4


   Total Empire           1,678,110        776,750     


GiveGab, Inc. (e)(g)    5,084,329 Series Seed Preferred.      3/13/13        4     616,221        616,221        2.0

Ithaca, NY. Online fundraising, day of giving supporter engagement software for non-profit organizations. (Software)

www.givegab.com

                
GoNoodle, Inc. (g)(m)    $1,000,000 Secured Note at 12%      2/6/15        <1     1,039,663        1,039,663        3.3

Nashville, TN. Student engagement education software providing core aligned physical activity breaks. (Software)

www.gonoodle.com


due January 31, 2020, (1% PIK).

Warrant for 47,324 Series C Preferred.


25


25


   Total GoNoodle           1,039,688        1,039,688     


Mercantile Adjustment Bureau, LLC (g)

Williamsville, NY. Full service


$1,199,039 Subordinated Secured

Note at 13% (3% for the calendar year 2018) due January 31, 2019.

     10/22/12        4     1,199,040        700,000        2.2
accounts receivable management and collections company. (Contact Center)   

(e) $150,000 Subordinated

Debenture at 8% due June 30, 2018.

          150,000        —       
www.mercantilesolutions.com    Warrant for 3.29% Membership Interests. Option for 1.5% Membership Interests.           97,625        —       
   (i) Interest receivable $50,254.              


Total Mercantile

          1,446,665        700,000     


Outmatch Holdings, LLC (e)(g)    2,798,883 Class P1 Units.      11/18/10        4     2,140,007        2,140,007        6.8
(Chequed Holdings, LLC)    109,788 Class C1 Units.           5,489        5,489     

Dallas, TX. Web based predictive employee selection and reference checking. (Software)

www.outmatch.com


   Total Outmatch           2,145,496        2,145,496     


PostProcess Technologies LLC (e)(g)    $300,000 Convertible Promissory      7/25/16        0     300,000        300,000        1.0

Buffalo, NY. Provides innovative solutions for the post-processing of additive manufactured 3D parts. (Manufacturing)

www.postprocess.com

   Note at 5% due July 28, 2020.              


39


Table of Contents

RAND CAPITAL CORPORATION AND SUBSIDIARY

CONSOLIDATED SCHEDULE OF PORTFOLIO INVESTMENTS

December 31, 2018 (Continued)


Company, Geographic Location, Business
Description, (Industry) and Website


(a)

Type of Investment

   (b)
Date
Acquired
   (c)
Equity
    Cost      (d)(f)
Fair
Value
     Percent
of Net
Assets
 

Rheonix, Inc. (e)

   9,676 Common.    10/29/09      4     —          —          7.0

Ithaca, NY. Developer of fully automated microfluidic based molecular assay and diagnostic testing devices. (Health Care)

www.rheonix.com

   (g) 1,839,422 Series A Preferred.           2,099,999        1,500,000     
   (g) 50,593 Common.           —          —       
   (g) 589,420 Series B Preferred.           702,732        702,732     


   Total Rheonix           2,802,731        2,202,732     


SocialFlow, Inc. (e)(g) New York, NY. Provides instant analysis of social networks using a proprietary, predictive analytic algorithm to optimize advertising and publishing. (Software) www.socialflow.com   

1,049,538 Series B Preferred.

1,204,819 Series B-1 Preferred.

717,772 Series C Preferred.

   4/5/13      4    

500,000
750,000
500,000


731,431
839,648
500,221


     6.6


   Total Social Flow           1,750,000        2,071,300     


Somerset Gas Transmission Company, LLC (e)    26.5337 Units.    7/10/02      3     719,097        500,000        1.6
Columbus, OH. Natural gas transportation. (Oil and Gas) www.somersetgas.com                 
                
                
Tech 2000, Inc. (g)(m)   

$600,000 Term Note at 14% (PIK through December 31, 2018) due

November 15, 2021.

   11/16/18      0     610,777        610,777        1.9

Herndon, VA. Develops and delivers IT training. (Software)

www.t2000inc.com


Other Non-Control/Non-Affiliate Investments:                 
DataView, LLC (e) (Software)    Membership Interest.    10/1/98      5     310,357        —          0.0
UStec/Wi3 (e) (Manufacturing)    Common stock.    12/17/98      <1     100,500        —          0.0


Subtotal Non-Control/Non-Affiliate Investments            $ 17,483,984      $ 17,541,213     


Affiliate Investments – 54.0% of net assets (k)                 
BeetNPath, LLC (Grainful) (e)(g)    1,119,024 Series A-2 Preferred Membership Units.    10/20/14      9   $ 359,000      $ —          1.7

Ithaca, NY. Frozen entrées made from 100% whole grain steel cut oats under Grainful brand name. (Consumer Product)

www.grainful.com

             
   1,032,918 Series B Preferred Membership Units.              
          261,277        261,277     
   $262,626.64 Convertible Secured Notes at 8% due December 21, 2019.           262,627        262,627     


   Total BeetNPath           882,904        523,904     


Carolina Skiff LLC (g)

Waycross, GA. Manufacturer of ocean fishing and pleasure boats. (Manufacturing)

www.carolinaskiff.com

   6.0825% Class A Common Membership Interest.    1/30/04      7     15,000        1,750,000        5.6
ClearView Social, Inc. (e)(g)    312,500 Series Seed Plus Preferred.    1/4/16      6     200,000        200,000        0.6

Buffalo, NY. Social media publishing tool for law, CPA and professional firms. (Software)

www.clearviewsocial.com


First Wave Technologies, Inc. (e)(g)    670,443.2 Class A Common.    4/19/12      5     661,563        33,000        0.1

Batavia, NY. Sells First Crush automated pill crusher that crushes and grinds pills for nursing homes and medical institutions. (Health Care)

www.firstwaveproducts.com


40


Table of Contents

RAND CAPITAL CORPORATION AND SUBSIDIARY

CONSOLIDATED SCHEDULE OF PORTFOLIO INVESTMENTS

December 31, 2018 (Continued)


Company, Geographic Location, Business
Description, (Industry) and Website


(a)

Type of Investment

   (b)
Date
Acquired
   (c)
Equity
    Cost      (d)(f)
Fair
Value
     Percent
of Net
Assets
 
Genicon, Inc. (g) (m)    1,586,902 Series B Preferred.    4/10/15      6     1,000,000        1,000,000        14.0

Winter Park, FL. Designs, produces and distributes patented surgical instrumentation. (Health Care)

www.geniconendo.com

   $3,250,000 Promissory Notes at 10%              
   due May 1, 2020, (8% PIK).           3,385,586        3,385,586     
   Warrants for 500,000 Common.           120,000        37,500     


   Total Genicon           4,505,586        4,423,086     


Knoa Software, Inc. (e)(g)   

973,533 Series A-1 Convertible

Preferred.

1,876,922 Series B Preferred.

   11/20/12      7     750,000        750,000        3.9

New York, NY. End user experience management and performance (EMP) solutions utilizing enterprise applications. (Software)

www.knoa.com


479,155


479,155


   Total Knoa           1,229,155        1,229,155     


KnowledgeVision Systems, Inc. (g)    200,000 Series A-1 Preferred.    11/13/13      7     250,000        —          3.2
Lincoln, MA. Online presentation and training software. (Software)    214,285 Series A-2 Preferred.           300,000        —       
   129,033 Series A-3 Preferred.           165,001        165,001     
www.knowledgevision.com    Warrant for 46,743 Series A-3.           35,000        35,000     
   $75,000 Subordinated Promissory Notes at 8% payable on demand of majority of holders after August 31, 2019.(e) $750,000 Term Note at 11% due April           75,000        75,000     
   30, 2021.           750,000        750,000     


   Total KnowledgeVision           1,575,001        1,025,001     


Mezmeriz, Inc. (e)(g)    1,554,565 Series Seed Preferred.    1/9/08      12     742,850        351,477        1.1

Ithaca, NY. Technology company developing novel reality capture tools for 3D mapping, reality modeling, object tracking and classification. (Electronics Developer)

www.mezmeriz.com

                
Microcision LLC (g)(m)    $1,500,000 Subordinated Promissory    9/24/09      15     1,933,353        1,933,353        8.1
Pennsauken Township, NJ. Manufacturer of precision machined medical implants, components and assemblies. (Manufacturing)    Note at 12% (1% PIK) due December              
   31, 2024.              
   15% Class A Common Membership              
www.microcision.com    Interest.           —          610,000     


   Total Microcision           1,933,353        2,543,353     


New Monarch Machine Tool, Inc. (g)    22.84 Common.    9/24/03      15     22,841        22,841        0.1
Cortland, NY. Manufactures and services vertical/horizontal machining centers. (Manufacturing)                 
www.monarchmt.com                 
OnCore Golf Technology, Inc. (e)(g)    300,483 Preferred AA.    12/31/14      8     752,712        300,000        1.0
Buffalo, NY. Patented and Proprietary Golf Balls utilizing breakthrough technology and innovation, inspiring golfers at all skill levels and abilities. (Consumer Product)                 
www.oncoregolf.com                 
SciAps, Inc. (e)(g)    187,500 Series A Preferred.    7/12/13      6     1,500,000        700,000        6.4

Woburn, MA. Instrumentation company

producing portable analytical devices using XRF, LIBS and RAMAN spectroscopy to identify compounds, minerals, and elements. (Manufacturing)

www.sciaps.com

   274,299 Series A-1 Convertible Preferred.           504,710        250,000     
   117,371 Series B Convertible Preferred.           250,000        250,000     
   113,636 Series C Convertible Preferred.           175,000        175,000     
   369,698 Series C-1 Convertible Preferred.           399,274        399,274     
   147,059 Series D Convertible Preferred.           250,000        250,000     


   Total SciAps           3,078,984        2,024,274     


41


Table of Contents

RAND CAPITAL CORPORATION AND SUBSIDIARY

CONSOLIDATED SCHEDULE OF PORTFOLIO INVESTMENTS

December 31, 2018 (Continued)


Company, Geographic Location, Business
Description, (Industry) and Website         


(a)

Type of Investment

   (b)
Date
Acquired
   (c)
Equity
    Cost      (d)(f)
Fair
Value
    Percent
of Net
Assets
 
Teleservices Solutions Holdings, LLC (e)(g)(m)    250,000 Class B Preferred Units.    5/30/14      6     250,000        —         0.0

Montvale, NJ. Customer contact center specializing in customer acquisition and retention for selected industries. (Contact Center)

www.ipacesetters.com


1,000,000 Class C Preferred Units.

80,000 Class D Preferred Units.

104,198 Class E Preferred Units.

PIK dividend for Series C and D at 12% and 14%, respectively.

          1,190,680        —      
          91,200        —      
          104,198        —      


   Total Teleservices           1,636,078        —      


Tilson Technology Management,

Inc. (g)

   120,000 Series B Preferred.    1/20/15      11     600,000        600,000       8.2
Portland, ME. Cellular, fiber optic and wireless    21,391 Series C Preferred.           200,000        200,000    
information systems, construction, and    70,176 Series D Preferred.           800,000        800,000    
management. (Professional Services)    $800,000 Subordinated Promissory             
www.tilsontech.com    Notes at 8% due December 1, 2022.           800,000        800,000    
   $200,000 Subordinated Promissory             
   Note at 8% due September 28, 2021.           200,000        200,000    


   Total Tilson           2,600,000        2,600,000    


Other Affiliate Investments:                
G-TEC Natural Gas Systems(e)    Membership Interest    8/31/99      17     400,000        —         0.0
(Manufacturing)                
SOMS Technologies, LLC (e)(g)    Membership Interest    12/2/08      9     472,632        —         0.0
(Consumer Products)                


Subtotal Affiliate Investments            $ 20,708,659      $ 17,026,091    


Control Investments – 0.3% of net assets (l)                
Advantage 24/7 LLC (g)    45% Membership Interest.    12/30/10      45   $ 99,500      $ 99,500       0.3
Williamsville, NY. Marketing program for wine and spirits dealers. (Marketing Company) www.advantage24-7.com                


Subtotal Control Investments            $ 99,500      $ 99,500    


TOTAL INVESTMENTS – 110%            $ 38,292,143      $ 34,666,804    


LIABILITIES IN EXCESS OF OTHER ASSETS – (10%)                 (3,142,617  


NET ASSETS – 100%               $ 31,524,187    


42


Table of Contents

RAND CAPITAL CORPORATION AND SUBSIDIARY

CONSOLIDATED SCHEDULE OF PORTFOLIO INVESTMENTS

December 31, 2018 (Continued)


Notes to the Consolidated Schedule of Portfolio Investments


(a)

At December 31, 2018, restricted securities represented 100% of the fair value of the investment portfolio. Restricted securities are subject to one or more restrictions on resale and are not freely marketable. Type of investment for equity position is in form of shares unless otherwise noted as units or interests, i.e., preferred shares, common shares.

(b)

The Date Acquired column indicates the date in which the Corporation first acquired an investment in the company or a predecessor company.

(c)

Each equity percentage estimates the Corporation’s ownership interest in the applicable portfolio investment. The estimated ownership is calculated based on the percent of outstanding voting securities held by the Corporation or the potential percentage of voting securities held by the Corporation upon exercise of warrants or conversion of debentures, or other available data. If applicable, the symbol “<1%” indicates that the Corporation holds an equity interest of less than one percent.

(d)

The Corporation’s investments are carried at fair value in accordance with Accounting Standards Codification (ASC) 820 “Fair Value Measurements and Disclosures,” which defines fair value and establishes guidelines for measuring fair value. At December 31, 2018, ASC 820 designates 100% of the Corporation’s investments as “Level 3” assets. Under the valuation policy of the Corporation, unrestricted publicly held securities are valued at the average closing bid price for these securities for the last three trading days of the reporting period. Restricted securities are subject to restrictions on resale, and are valued at fair value as determined by the management of the Corporation and submitted to the Board of Directors for approval. Fair value is considered to be the amount that the Corporation may reasonably expect to receive for portfolio securities when sold on the valuation date. Valuations as of any particular date, however, are not necessarily indicative of amounts which may ultimately be realized as a result of future sales or other dispositions of securities and these favorable or unfavorable differences could be material. Among the factors considered in determining the fair value of restricted securities are the financial condition and operating results, projected operations, and other analytical data relating to the investment. Also considered are the market prices for unrestricted securities of the same class (if applicable) and other matters which may have an impact on the value of the portfolio company (see Note 2 “Investments” to the Consolidated Financial Statements).

(e)

These investments are non-income producing. All other investments are income producing. Non-income producing investments have not generated cash payments of interest or dividends including LLC tax-related distributions within the last twelve months, or are not expected to do so going forward. However, if a debt or a preferred equity fails to make its most recent payment, then the investment will also be classified as non-income producing.

(f)

As of December 31, 2018 the total cost of investment securities was approximately $38.3 million. Net unrealized depreciation was approximately ($3.6) million, which was comprised of $5.3 million of unrealized appreciation of investment securities and ($8.9) million of unrealized depreciation of investment securities. At December 31, 2018, the aggregate gross unrealized gain for federal income tax purposes was $5.2 million and the aggregate gross unrealized loss for federal income tax purposes was ($5.9) million. The net unrealized loss for federal income tax purposes was ($0.7) million based on a tax cost of $35.4 million.

(g)

Rand Capital SBIC, Inc. investment.

(h)

Reduction in cost and value from previously reported balances reflects current principal repayment.

(i)

Represents interest due (amounts over $50,000) from investments included as interest receivable on the Corporation’s Consolidated Statements of Financial Position.

(j)

Non-Control/Non-Affiliate Investments are investments that are neither Control Investments nor Affiliate Investments.

(k)

Affiliate Investments are defined by the Investment Company Act of 1940, as amended (“1940 Act”), as those Non-Control investments in companies in which between 5% and 25% of the voting securities are owned by the Corporation.

(l)

Control Investments are defined by the 1940 Act as investments in companies in which more than 25% of the voting securities are owned by the Corporation or where greater than 50% of the board representation is maintained.

(m)

Payment in kind (PIK) represents earned interest that is added to the cost basis of the investment.


43


Table of Contents

RAND CAPITAL CORPORATION AND SUBSIDIARY

CONSOLIDATED SCHEDULE OF PORTFOLIO INVESTMENTS

December 31, 2018 (Continued)


Investments in and Advances to Affiliates


Company


Type of Investment

  December 31,
2017

Fair Value
    Gross
Additions (1)
    Gross
Reductions
(2)
    December 31,
2018
Fair Value
    Net
Realized
(Losses)
    Amount of
Interest/
Dividend/
Fee
Income (3)
 

Control Investments:


Advantage 24/7 LLC

  45% Membership Interest.   $ 99,500     $ —       $ —       $ 99,500     $ —       $ 60,000  


  Total Control Investments   $ 99,500     $ —       $ —       $ 99,500     $ —       $ 60,000  


Affiliate Investments:

             
BeetNPath, LLC   1,119,024 Series A-2 Preferred Membership Units.   $ 359,000     $ —       ($ 359,000   $ —       $ —       $ —    
  1,032,918 Series B Preferred Membership Units.     291,000       —         (29,723     261,277       —         —    
  $262,626.64 Convertible Secured Note at 8%     —         262,627       —         262,627       —         5,413  


  Total BeetNPath     650,000       262,627       (388,723     523,904       —         5,413  


Carolina Skiff LLC   6.0825% Class A Common Membership interest.     1,750,000       —         —         1,750,000       —         251,913  
ClearView Social, Inc.   312,500 Series Seed Plus Preferred.     200,000       —         —         200,000       —         —    
First Wave Technologies, Inc.   $500,000 senior term notes at 10%.     250,000       —         (250,000     —         (316,469     —    
  $280,000 junior term notes at 10%     —         —         —         —         —         —    
  Warrant for 41,619 capital securities.     —         —         —         —         ( 22,000     —    
  670,443.2 Class A Common.     —         33,000       —         33,000       —         —    


  Total First Wave     250,000       33,000       (250,000     33,000       (338,469     —    


Genicon, Inc.   1,586,902 Series B Preferred.     1,000,000       —         —         1,000,000       —         —    
  $3,250,000 Promissory Notes at 8%.     2,903,779       481,807       —         3,385,586       —         348,512  
  Warrant for 250,000 Common.     120,000       —         (82,500     37,500       —         —    


  Total Genicon     4,023,779       481,807       (82,500     4,423,086       —         348,512  


GiveGab, Inc.   5,084,329 Series Seed Preferred.     424,314       191,907       (616,221     —         —         —    
G-TEC Natural Gas Systems   16.639% Class A Membership Interest. 8% cumulative dividend.     100,000       —         (100,000     —         (1,125,673     —    
Intrinsiq Materials, Inc.   4,161,747 Series A Preferred.     400,000       —         (400,000     —         —         —    
Knoa Software, Inc.   973,533 Series A-1 Convertible Preferred.     750,000       —         —         750,000       —         —    
  1,876,922 Series B Preferred.     479,155       —         —         479,155       —         —    
  $48,466 Convertible Promissory Note at 8%.     48,466       —         (48,466     —         —         773  


  Total Knoa     1,277,621       —         (48,466     1,229,155       —         773  


KnowledgeVision   200,000 Series A-1 Preferred.     —         —         —         —         —         —    
Systems, Inc.   214,285 Series A-2 Preferred.     300,000       —         (300,000     —         —         —    
  129,033 Series A-3 Preferred.     165,001       —         —         165,001       —         —    
  $75,000 Subordinated Promissory Notes at            
  8%     50,000       25,000       —         75,000       —         5,408  
  $750,000 term note at 11%     —         750,000       —         750,000       —         60,241  
  Warrant for 46,743 Series A-3.     35,000       —         —         35,000       —         —    


  Total KnowledgeVision     550,001       775,000       (300,000     1,025,001       —         65,649  


Mezmeriz, Inc.   1,554,565 Series Seed Preferred.     351,477       —         —         351,477       —         —    
Microcision LLC   $1,500,000 Subordinated Promissory Note at 12% (1% PIK) due December 31, 2024.     1,914,140       19,213       —         1,933,353       —         230,559  
  15% Class A Common Membership Interest.     —         610,000       —         610,000       —         —    


  Total Microcision     1,914,140       629,213       —         2,543,353       —         230,559  


New Monarch Machine Tool, Inc.   22.84 Common.     22,841       —         —         22,841       —         29,409  


44


Table of Contents

RAND CAPITAL CORPORATION AND SUBSIDIARY

CONSOLIDATED SCHEDULE OF PORTFOLIO INVESTMENTS

December 31, 2018 (Continued)


Investments in and Advances to Affiliates


Company


Type of Investment

  December 31,
2017 Fair
Value
    Gross
Additions

(1)
    Gross
Reductions
(2)
    December 31,
2018 Fair
Value
    Net
Realized
(Losses)
    Amount of
Interest/
Dividend/
Fee Income
(3)
 

OnCore Golf

Technology, Inc.


150,000 Series AA Preferred.

$300,000 Subordinated Convertible

    —         300,000       —         300,000       —         —    
  Promissory notes at 6%.     300,000       —         (300,000     —         —         27,370  


  Total OnCore     300,000       300,000       (300,000     300,000       —         27,370  


SciAps, Inc.

  187,500 Series A Convertible Preferred.     700,000       —         —         700,000       —         —    
  274,299 Series A-1 Convertible Preferred.     250,000       —         —         250,000       —         —    
  117,371 Series B Convertible Preferred.     250,000       —         —         250,000       —         —    
  113,636 Series C Preferred.     175,000       —         —         175,000       —         —    
  369,698 Series C-1 Preferred.     399,274       —         —         399,274       —         —    
  147,059 Series D Convertible Preferred     —         250,000       —         250,000       —         —    


  Total SciAps     1,774,274       250,000       —         2,024,274       —         —    


SOMS

Technologies, LLC

  5,959,490 Series B membership Interests.     528,348       —         (528,348     —         —         —    

Teleservices

Solutions

Holdings, LLC

  250,000 Class B Preferred Units.     —         —         —         —         —         —    
  1,000,000 Class C Preferred Units.     —         —         —         —         —         —    
  80,000 Class D Preferred Units.     —         —         —         —         —         —    
  104,198 Class E Preferred Units.     —         —         —         —         —         —    


  Total Teleservices     —         —         —         —         —         —    


Tilson Technology

Management, Inc.

  120,000 Series B Preferred.     600,000       —         —         600,000       —         20,000  
  21,391 Series C Convertible Preferred.     200,000       —         —         200,000       —         —    
  70,176 Series D Preferred.     750,000       50,000       —         800,000       —         19,003  
  $200,000 Subordinated Promissory Note
at 8%.
    200,000       —         —         200,000       —         16,000  
  $800,000 Subordinated Promissory Note
at 8%.
    750,000       50,000       —         800,000       —         60,822  


  Total Tilson     2,500,000       100,000       —         2,600,000       —         115,825  


  Total Affiliate Investments   $ 17,016,795     $ 3,023,554     ($ 3,014,258 )    $ 17,026,091     ($ 1,464,142 )    $ 1,075,423  


  Total Control and Affiliate Investments   $ 17,116,295     $ 3,023,554     ($ 3,014,258 )    $ 17,125,591     ($ 1,464,142 )    $ 1,135,423  


This schedule should be read in conjunction with the Corporation’s Consolidated Financial Statements, including the Consolidated Schedule of Portfolio Investments and Notes to the Consolidated Financial Statements.


(1)

Gross additions include increases in the cost basis of investments resulting from new portfolio investments, follow on investments, capitalized interest and the accretion of discounts. Gross additions also include net increases in unrealized appreciation or net decreases in unrealized depreciation, and the movement of an existing portfolio company into this category and out of another category.

(2)

Gross reductions include decreases in the cost basis of investments resulting from principal repayments, sales, note conversions, net increases in unrealized depreciation, net decreases in unrealized appreciation, the exchange of existing securities for new securities and the movement of an existing portfolio company out of this category and into another category.

(3)

Represents the total amount of interest, fees or dividends credited to income for the portion of the period an investment was included in Control or Affiliate categories, respectively.


45


Table of Contents

RAND CAPITAL CORPORATION AND SUBSIDIARY

CONSOLIDATED SCHEDULE OF PORTFOLIO INVESTMENTS

December 31, 2018 (Continued)


Industry Classification

   Percentage of Total
Investments (at fair value)
as of December 31, 2018
 

Software

     33.8

Healthcare

     32.4  

Manufacturing

     19.2  

Professional Services

     7.5  

Consumer Product

     2.4  

Contact Center

     2.0  

Oil and Gas

     1.4  

Electronics

     1.0  

Marketing

     0.3  


Total Investments

     100


46


Table of Contents

RAND CAPITAL CORPORATION AND SUBSIDIARIES

CONSOLIDATED SCHEDULE OF PORTFOLIO INVESTMENTS

December 31, 2017


Company, Geographic Location, Business

Description, (Industry) and Website         


(a)

Type of Investment

  (b)
Date
Acquired
    (c)
Equity
    Cost     (d)(f)
Fair
Value
    Percent
of Net
Assets
 

Non-Control/Non-Affiliate Investments – 47.5% of net assets: (j)


ACV Auctions, Inc. (e)(g)

Buffalo, NY. Live mobile wholesale auctions for new and used car dealers. (Software)

www.acvauctions.com

  1,181,160 Series A preferred shares.     8/12/16       <1   $ 163,000     $ 282,356       0.9

Centivo Corporation (e)(n)

New York, NY. Tech-enabled health solutions company that helps self-insured employers and their employees save money and have a better experience.

(Health Care)

  $100,000 convertible unsecured note at 2% due February 1, 2019.     7/5/17       0     100,000       100,000       0.3

eHealth Global Technologies, Inc.

Henrietta, NY. eHealth Connect® improves health

care delivery through intelligently aggregated clinical record and images for patient referrals.

(Health Care)

www.ehealthtechnologies.com


(g) $1,500,000 term note at 10% due September 2, 2019.

(n) $2,000,000 term note at 10% due September 2, 2019.

    6/28/16       0     1,500,000       1,500,000       11.0
        2,000,000       2,000,000    


  Total eHealth         3,500,000       3,500,000    


Empire Genomics, LLC (g)

Buffalo, NY. Molecular diagnostics company that offers a comprehensive menu of assay services for

diagnosing and guiding patient therapeutic treatments. (Health Care)

www.empiregenomics.com


$1,101,489 senior secured convertible term notes at 10% due April 30, 2018.

$250,000 promissory note at 12% due December 31, 2019.

    6/13/14       0     1,101,489       1,101,489       4.2
        250,000       250,000    


  (i) Interest receivable $65,906.          
  Total Empire         1,351,489       1,351,489    


GoNoodle, Inc. (g)(m)

(Formerly HealthTeacher, Inc.)

Nashville, TN. Student engagement education

software providing core aligned physical activity

breaks. (Software)

www.gonoodle.com


$1,000,000 secured note at 12% due January 31, 2020, (1% Payment in Kind (PIK)).

Warrant for 47,324 Series C

Preferred shares.

    2/6/15       <1     1,029,330       1,029,330       3.2
         
        25       25    


  Total GoNoodle         1,029,355       1,029,355    


Mercantile Adjustment Bureau, LLC (g)

Williamsville, NY. Full service accounts receivable management and collections company.

(Contact Center)

www.mercantilesolutions.com

  $1,199,039 subordinated secured note at 13% (3% for the calendar year 2017) due January 31, 2018.     10/22/12       4     1,199,040       949,040       3.0
  (e) $150,000 subordinated debenture at 8% due June 30, 2018.         150,000       —      
 

Warrant for 3.29% membership interests. Option for 1.5% membership interests.

(i) Interest receivable $55,983.

        97,625       —      


  Total Mercantile         1,446,665       949,040    


Outmatch Holdings, LLC (e)(g)

(Chequed Holdings, LLC)

Dallas, TX. Web based predictive employee selection and reference checking. (Software)

www.outmatch.com


2,641,899 Class P1 Units.

109,788 Class C1 Units.

    11/18/10       4     2,140,007       2,140,007       6.7
        5,489       5,489    


  Total Outmatch         2,145,496       2,145,496    


PostProcess Technologies LLC (e)(g)

Buffalo, NY. Provides innovative solutions for the post-processing of additive manufactured 3D parts. (Manufacturing)

www.postprocess.com

  $300,000 convertible promissory note at 5% due July 28, 2018.     7/25/16       0     300,000       300,000       0.9


47


Table of Contents

RAND CAPITAL CORPORATION AND SUBSIDIARIES

CONSOLIDATED SCHEDULE OF PORTFOLIO INVESTMENTS

December 31, 2017 (Continued)


Company, Geographic Location, Business

Description, (Industry) and Website         


(a)

        Type of Investment        


(b)

Date
  Acquired  


(c)    

    Equity    

          Cost              

(d)(f)

Fair

        Value        

    Percent
of Net
  Assets  
 

Rheonix, Inc. (e)

Ithaca, NY. Developer of fully automated microfluidic based molecular assay and diagnostic

testing devices. (Health Care)

www.rheonix.com

  9,676 common shares.     10/29/09       4     —         11,000       9.2
  (g) 1,839,422 Series A preferred shares.         2,099,999       2,165,999    
  (g) 50,593 common shares.         —         59,000    
  (g) 589,420 Series B preferred shares.         702,732       702,732    


  Total Rheonix         2,802,731       2,938,731    


SocialFlow, Inc. (e)(g)

New York, NY. Provides instant analysis of social

networks using a proprietary, predictive analytic

algorithm to optimize advertising and publishing.

(Software)

www.socialflow.com

  1,049,538 Series B preferred shares.     4/5/13       4     500,000       731,431       6.5
  1,204,819 Series B-1 preferred shares.         750,000       839,648    
  717,772 Series C preferred shares.         500,000       500,221    


  Total Social Flow         1,750,000       2,071,300    


Somerset Gas Transmission Company, LLC (e)

Columbus, OH. Natural gas transportation.

(Oil and Gas)

www.somersetgas.com

  26.5337 units.     7/10/02       3     719,097       500,000       1.6
Other Non-Control/Non-Affiliate Investments:            
DataView, LLC (Software) (e)   Membership Interest.     —         —         310,357       —         0.0
UStec/Wi3 (Manufacturing) (e)   Common Stock.     —         —         100,500       —         0.0


Subtotal Non-Control/Non-Affiliate Investments         $ 15,718,690     $ 15,167,767    


Affiliate Investments – 53.3% of net assets (k)            

BeetNPath, LLC (Grainful) (e)(g)

Ithaca, NY. Frozen entrées and packaged dry side

dishes made from 100% whole grain steel cut oats under Grainful brand name. (Consumer Product)

www.grainful.com

  1,119,024 Series A-2 Preferred Membership Units.     10/20/14       9   $ 359,000     $ 359,000       2.0
  1,032,918 Series B Preferred Membership Units.         261,277       291,000    


  Total BeetNPath         620,277       650,000    


Carolina Skiff LLC (g)

Waycross, GA. Manufacturer of fresh water,

ocean fishing and pleasure boats.

(Manufacturing)

www.carolinaskiff.com

  6.0825% Class A common membership interest.     1/30/04       7     15,000       1,750,000       5.5

ClearView Social, Inc. (e)(g)

Buffalo, NY. Social media publishing tool for law,

CPA and professional firms. (Software)

www.clearviewsocial.com

  312,500 Series seed plus preferred shares.     1/4/16       6     200,000       200,000       0.6

First Wave Products Group, LLC (e)(g)

Batavia, NY. Sells First Crush automated pill crusher that crushes and grinds medical pills for nursing homes and medical institutions. (Health Care)

www.firstwaveproducts.com

  $500,000 senior term notes at 10% due July 31, 2017.     4/19/12       7     661,563       250,000       0.8
  $280,000 junior term notes at 10% due July 31, 2017.         316,469       —      
  Warrant for 41,619 capital securities.         22,000       —      


  Total First Wave         1,000,032       250,000    


Genicon, Inc.

Winter Park, FL. Designs, produces and distributes patented surgical instrumentation.

(Health Care)

www.geniconendo.com

  (g) 1,586,902 Series B preferred shares.     4/10/15       6     1,000,000       1,000,000       12.6
  (g) $2,000,000 promissory note at 8% due May 1, 2020.         1,936,002       1,936,002    
  (g) Warrant for 250,000 common shares.         80,000       80,000    
  (n) $1,000,000 promissory note at 8% due May 1, 2020.         967,777       967,777    
  (n) Warrant for 125,000 common shares.         40,000       40,000    


  Total Genicon         4,023,779       4,023,779    


48


Table of Contents

RAND CAPITAL CORPORATION AND SUBSIDIARIES

CONSOLIDATED SCHEDULE OF PORTFOLIO INVESTMENTS

December 31, 2017 (Continued)


Company, Geographic Location, Business

Description, (Industry) and Website


(a)

Type of Investment

   (b)
Date
Acquired
   (c)
Equity
    Cost      (d)(f)
Fair
Value
     Percent
of Net
Assets
 
GiveGab, Inc. (e)(g)    5,084,329 Series Seed preferred shares.    3/13/13      6     616,221        424,314        1.3

Ithaca, NY. Online fundraising, day of giving supporter engagement software for non-profit organizations. (Software)

www.givegab.com


G-TEC Natural Gas Systems (e)

Buffalo, NY. Manufactures and distributes systems that allow natural gas to be used as an alternative fuel to gases. (Manufacturing)

www.gas-tec.com

   16.639% Class A membership interest. 8% cumulative dividend.    8/31/99      17     400,000        100,000        0.3
Intrinsiq Materials, Inc. (e)(g)    4,161,747 Series A preferred shares.    9/19/13      12     1,125,673        400,000        1.3

Rochester, NY. Produces printable electronics utilizing a unique process of nanomaterial based ink in a room-temperature environment. (Manufacturing)

www.intrinsiqmaterials.com


Knoa Software, Inc. (g)

New York, NY. End user experience

   973,533 Series A-1 convertible preferred shares.    11/20/12      7     750,000        750,000        4.0
management and performance (EMP) solutions utilizing enterprise applications. (Software)    1,876,922 Series B preferred shares. $48,466 convertible promissory note at           479,155        479,155     
www.knoa.com    8% due May 9, 2018.           48,466        48,466     


   Total Knoa           1,277,621        1,277,621     


KnowledgeVision Systems, Inc. (e)(g)    200,000 Series A-1 preferred shares.    11/13/13      7     250,000        —          1.7
Lincoln, MA. Online presentation and training software. (Software)    214,285 Series A-2 preferred shares.           300,000        300,000     
   129,033 Series A-3 preferred shares.           165,001        165,001     
www.knowledgevision.com    Warrant for 46,743 Series A-3 shares.           35,000        35,000     
   $50,000 subordinated promissory note              
   at 8% payable on demand of majority of              
   noteholders after August 31, 2017.           50,000        50,000     


   Total KnowledgeVision           800,001        550,001     


Mezmeriz, Inc. (e)(g)    1,554,565 Series Seed preferred shares.    1/9/08      14     742,850        351,477        1.1

Ithaca, NY. Micro-electronic mechanical systems (MEMS) developer of carbon fiber MEMS mirror modules for gesture recognition and 3D scanning. (Electronics Developer)

www.mezmeriz.com


Microcision LLC (g)(m)

Pennsauken Township, NJ. Manufacturer of precision machined medical implants,

   $1,500,000 subordinated promissory note at 12% (1% PIK) due December 31, 2024.    9/24/09      15     1,914,140        1,914,140        6.0

components and assemblies. (Manufacturing)

www.microcision.com

   15% Class A common membership interest.           —          —       


   Total Microcision           1,914,140        1,914,140     


New Monarch Machine Tool, Inc. (g)    22.84 common shares.    9/24/03      15     22,841        22,841        0.1

Cortland, NY. Manufactures and services vertical/horizontal machining centers. (Manufacturing)

www.monarchmt.com


49


Table of Contents

RAND CAPITAL CORPORATION AND SUBSIDIARIES

CONSOLIDATED SCHEDULE OF PORTFOLIO INVESTMENTS

December 31, 2017 (Continued)


Company, Geographic Location, Business
Description, (Industry) and Website         


(a)

    Type of Investment    


(b)

Date

    Acquired    


(c)

    Equity    

        Cost        

(d)(f)

Fair

    Value    


Percent

of Net

    Assets    


OnCore Golf Technology, Inc. (e)(g)

Buffalo, NY. Maker of patented golf balls. (Consumer Product) www.oncoregolf.com


150,000 Series AA preferred shares.

$300,000 subordinated convertible promissory notes at 6% (10% for calendar year 2017) due January 24, 2018.

  12/31/14     9     375,000       —         0.9
  (i) Interest receivable $50,342.         300,000       300,000    


  Total OnCore         675,000       300,000    


SciAps, Inc. (e)(g)

Woburn, MA. Instrumentation

  187,500 Series A convertible preferred shares.   7/12/13     8     1,500,000       700,000       5.6
company producing portable analytical devices using XRF, LIBS and   274,299 Series A-1 convertible preferred shares.         504,710       250,000    
RAMAN spectroscopy to identify compounds, minerals, and elements.   117,371 Series B convertible preferred shares.         250,000       250,000    
(Manufacturing)   113,636 Series C preferred shares.         175,000       175,000    
www.sciaps.com   369,698 Series C-1 preferred shares.         399,274       399,274    


  Total SciAps         2,828,984       1,774,274    


SOMS Technologies, LLC (e)(g) Valhalla, NY. Produces and markets the microGreen Extended Performance Oil Filter. (Consumer Products) www.microgreenfilter.com   5,959,490 Series B membership interests.   12/2/08     9     472,632       528,348       1.7

Teleservices Solutions Holdings,

LLC (e)(g)(m)

Montvale, NJ. Customer contact center specializing in customer acquisition and retention for selected industries. (Contact Center)

www.ipacesetters.com

  250,000 Class B preferred units.   5/30/14     6     250,000       —         0.0
  1,000,000 Class C preferred units.             1,190,680       —      
  80,000 Class D preferred units.         91,200       —      
  104,198 Class E preferred units.         104,198       —      
  PIK dividend for Series C and D at 12% and 14%, respectively.          


  Total Teleservices         1,636,078       —      


Tilson Technology Management, Inc   (g) 120,000 Series B preferred shares.   1/20/15     11     600,000       600,000       7.8

Portland, ME. Cellular, fiber optic and wireless information systems, construction, and management. (Professional Services)

www.tilsontech.com

  21,391 Series C convertible preferred shares.         200,000       200,000    
  (g) $200,000 subordinated promissory note at 8% due September 28, 2021.         200,000       200,000    
  (n) 65,790 Series D preferred shares.         750,000       750,000    
  (n) $750,000 subordinated promissory          
  note at 8% due December 1, 2022.         750,000       750,000    


  Total Tilson         2,500,000       2,500,000    


Subtotal Affiliate Investments         $ 20,871,129     $ 17,016,795    


Control Investments – 0.3% of net assets (l)            
Advantage 24/7 LLC (e)(g)   53% Membership interest.   12/30/10     53   $ 99,500     $ 99,500       0.3
Williamsville, NY. Marketing program for wine and spirits dealers. (Marketing Company)            
www.advantage24-7.com            


Subtotal Control Investments         $ 99,500     $ 99,500    


TOTAL INVESTMENTS – 101.1%         $ 36,689,319     $ 32,284,062    
LIABLITIES IN EXCESS OF OTHER ASSETS – (1.1%)             (365,377  


NET ASSETS – 100%           $ 31,918,685    


50


Table of Contents

RAND CAPITAL CORPORATION AND SUBSIDIARIES

CONSOLIDATED SCHEDULE OF PORTFOLIO INVESTMENTS

December 31, 2017 (Continued)


Notes to the Consolidated Schedule of Portfolio Investments


(a)

At December 31, 2017, restricted securities represented 100% of the fair value of the investment portfolio. Restricted securities are subject to one or more restrictions on resale and are not freely marketable.

(b)

The Date Acquired column indicates the year in which the Corporation first acquired an investment in the company or a predecessor company.

(c)

Each equity percentage estimates the Corporation’s ownership interest in the applicable portfolio investment. The estimated ownership is calculated based on the percent of outstanding voting securities held by the Corporation or the potential percentage of voting securities held by the Corporation upon exercise of warrants or conversion of debentures, or other available data. If applicable, the symbol “<1%” indicates that the Corporation holds an equity interest of less than one percent.

(d)

The Corporation’s investments are carried at fair value in accordance with Accounting Standards Codification (ASC) 820 “Fair Value Measurements and Disclosures,” which defines fair value and establishes guidelines for measuring fair value. At December 31, 2017, ASC 820 designates 100% of the Corporation’s investments as “Level 3” assets. Under the valuation policy of the Corporation, unrestricted publicly held securities are valued at the average closing bid price for these securities for the last three trading days of the reporting period. Restricted securities are subject to restrictions on resale, and are valued at fair value as determined by the management of the Corporation and submitted to the Board of Directors for approval. Fair value is considered to be the amount that the Corporation may reasonably expect to receive for portfolio securities when sold on the valuation date. Valuations as of any particular date, however, are not necessarily indicative of amounts which may ultimately be realized as a result of future sales or other dispositions of securities and these favorable or unfavorable differences could be material. Among the factors considered in determining the fair value of restricted securities are the financial condition and operating results, projected operations, and other analytical data relating to the investment. Also considered are the market prices for unrestricted securities of the same class (if applicable) and other matters which may have an impact on the value of the portfolio company (see Note 2 “Investments” to the Consolidated Financial Statements).

(e)

These investments are non-income producing. All other investments are income producing. Non-income producing investments have not generated cash payments of interest or dividends including LLC tax-related distributions within the last twelve months, or are not expected to do so going forward.

(f)

As of December 31, 2017, the total cost of investment securities was approximately $36.7 million. Net unrealized depreciation was approximately ($4.4) million, which was comprised of $2.4 million of unrealized appreciation of investment securities and ($6.8) million of unrealized depreciation of investment securities. At December 31, 2017, the aggregate gross unrealized gain for federal income tax purposes was $2.8 million and the aggregate gross unrealized loss for federal income tax purposes was ($4.4) million. The net unrealized loss for federal income tax purposes was ($1.6) million based on a tax cost of $33.9 million.

(g)

Rand Capital SBIC, Inc. investment.

(h)

Reduction in cost and value from previously reported balances reflects current principal repayment. There were no principal repayments during the year ended December 31, 2017.

(i)

Represents interest due (amounts over $50,000) from investments included as interest receivable on the Corporation’s Consolidated Statements of Financial Position.

(j)

Non-Control/Non-Affiliate Investments are investments that are neither Control Investments nor Affiliate Investments.

(k)

Affiliate Investments are defined by the Investment Company Act of 1940, as amended (“1940 Act”), as those Non-Control investments in companies in which between 5% and 25% of the voting securities are owned by the Corporation.

(l)

Control Investments are defined by the 1940 Act as investments in companies in which more than 25% of the voting securities are owned by the Corporation or where greater than 50% of the board representation is maintained.

(m)

Payment in kind (PIK) represents earned interest that is added to the cost basis of the investment.

(n)

Rand Capital SBIC II, L.P. investment.


51


Table of Contents

RAND CAPITAL CORPORATION AND SUBSIDIARIES

CONSOLIDATED SCHEDULE OF PORTFOLIO INVESTMENTS

December 31, 2017 (Continued)


Investments in and Advances to Affiliates


Company


Type of Investment

  December 31,
2016
Fair Value
    Gross
Additions
(1)
    Gross
Reductions
(2)
    December 31,
2017 Fair
Value
    Net
Realized
Gains
(Losses)
    Amount of
Interest/
Dividend/
Fee Income (3)
 
Control Investments:            
Advantage 24/7 LLC   53% Membership interest.   $ 99,500     $ —       $ —       $ 99,500     $ —       $ —    


Total Control Investments

  $ 99,500     $ —       $ —       $ 99,500     $ —        $ —    


Affiliate Investments:            
BeetNPath, LLC  

1,119,024 Series A-2 Preferred Membership Units.

1,032,918 Series B Preferred Membership Units

$150,000 convertible promissory note at 8%.

  $ 359,000     $ —       $ —       $ 359,000     $ —       $ —    
    —       $ 291,000       —         291,000      
—  
—  
 
 
    —    
    150,000       —         (150,000     —         —         4,800  


Total BeetNPath

    509,000       291,000       (150,000     650,000       —         4,800  


Carolina Skiff LLC   6.0825% Class A common membership interest.     1,100,000       650,000       —         1,750,000       —         178,532  
ClearView Social, Inc.   312,500 Series seed plus preferred shares.     200,000       —         —         200,000       —         —    
First Wave Products Group, LLC   $500,000 senior term notes at 10%.     250,000       —         —         250,000       —         —    
  $280,000 junior term notes at 10%.     —         —         —         —         —         —    
  Warrant for 41,619 capital securities.     —         —         —         —         —         —    


Total First Wave

    250,000       —         —         250,000       —         —    


Genicon, Inc.  

1,586,902 Series B preferred shares.

$1,100,000 senior term loans at 12%.

$600,000 term loan at 14%.

$2,000,000 promissory note at 8%

$1,000,000 promissory note at 8%

Warrant for 250,000 common shares

Warrant for 125,000 common shares

    1,000,000       —         —         1,000,000       —         —    
    1,100,000       —         (1,100,000     —         —         50,234  
    600,000       —         (600,000     —         —         32,200  
    —         2,016,002       (80,000     1,936,002       —         129,752  
    —         1,007,777       (40,000     967,777       —         60,860  
    —         80,000       —         80,000       —      
    —         40,000       —         40,000       —         —    


Total Genicon

    2,700,000       3,143,779       (1,820,000     4,023,779       —         273,046  


GiveGab, Inc.   5,084,329 Series Seed preferred shares.     424,314       —         —         424,314       —         —    
G-TEC Natural Gas Systems   16.639% Class A membership interest. 8% cumulative dividend     100,000       —         —         100,000       —         —    
Intrinsiq Materials, Inc.   4,161,747 Series A preferred shares.     780,000       —         (380,000     400,000       —         —    
Knoa Software, Inc.  

973,533 Series A-1 convertible preferred

shares.

1,876,922 Series B preferred shares.

$48,466 convertible promissory note at 8%.

    —         750,000       —         750,000       —         —    
    449,455       29,700       —         479,155       —         —    
    48,466       —         —         48,466       —         3,877  


Total Knoa

    497,921       779,700       —         1,277,621       —         3,877  


KnowledgeVision

Systems, Inc.


200,000 Series A-1 preferred shares.

214,285 Series A-2 preferred shares.

129,033 Series A-3 preferred shares.

$50,000 subordinated promissory note at 8%

Warrant for 46,743 Series A-3 shares.

    —         —         —         —         —         —    
    300,000       —         —         300,000       —         —    
    165,001       —         —         165,001       —         —    
    —         50,000       —         50,000       —         3,748  
    35,000       —         —         35,000       —         —    


Total Knowledge Vision

    500,001       50,000       —         550,001       —         3,748  


Mezmeriz, Inc.   1,554,565 Series seed preferred shares.     351,477       —         —         351,477       —         —    
Microcision LLC   $1,500,000 subordinated promissory note at 11%.     1,891,964       22,176       —         1,914,140       —         228,239  

New Monarch

Machine Tool, Inc.

  22.84 common shares.     22,841       —         —         22,841       —         28,409  


52


Table of Contents

RAND CAPITAL CORPORATION AND SUBSIDIARIES

CONSOLIDATED SCHEDULE OF PORTFOLIO INVESTMENTS

December 31, 2017 (Continued)


Investments in and Advances to Affiliates


Company


Type of Investment

  December 31,
2016 Fair
Value
    Gross
Additions
(1)
    Gross
Reductions
(2)
    December 31,
2017 Fair
Value
    Net
Realized
Gains
(Losses)
    Amount of
Interest/
Dividend/
Fee Income (3)
 

OnCore Golf

Technology, Inc.

  150,000 Series AA preferred shares.     —         —         —         —         —         —    
  $300,000 subordinated convertible promissory notes at 6%.     300,000       —         —         300,000       —         29,211  


  Total OnCore     300,000       —         —         300,000       —         29,211  


SciAps, Inc.   187,500 Series A convertible preferred shares.     1,000,000       —         (300,000     700,000       —         —    
  274,299 Series A-1 convertible preferred shares.     504,710       —         (254,710     250,000       —         —    
  117,371 Series B convertible preferred shares.     250,000       —         —         250,000       —         —    
  113,636 Series C preferred shares.     —         175,000       —         175,000       —         —    
  369,698 Series C-1 preferred shares.     —         399,274       —         399,274       —         —    
  $200,000 subordinated promissory note at 10%.     200,000       —         (200,000     —         —         4,731  
  $100,000 secured subordinated convertible note at 10%.     100,000       —         (100,000     —         —         2,376  


  Total SciAps     2,054,710       574,274       (854,710     1,774,274       —         7,107  


SOMS

Technologies, LLC

  5,959,490 Series B membership interests.     528,348       —         —         528,348       —         6,024  

Teleservices

Solutions

Holdings, LLC


250,000 Class B shares.

1,000,000 Class C shares.

80,000 Class D preferred units.

104,198 Class E preferred units.

    —         —         —         —         —         —    
    200,000       —         (200,000     —         —         —    
    91,200       —         ( 91,200     —         —         —    
    104,198       —         (104,198     —         —         —    


  Total Teleservices     395,398       —         (395,398     —         —         —    


Tilson Technology

Management, Inc.

  120,000 Series B preferred shares.     600,000       —         —         600,000       —         20,000  
 

21,391 Series C convertible preferred shares.

$200,000 subordinated promissory note at 8%.

65,790 Series D preferred shares.

$750,000 subordinated promissory note at 8%.

    200,000       —         —         200,000       —         —    
    200,000       —           200,000       —         16,000  
    —         750,000         750,000         1,579  
           
    —         750,000       —         750,000       —         5,096  


  Total Tilson     1,000,000       1,500,000       —         2,500,000       —         42,675  


  Total Affiliate Investments   $ 13,605,974     $ 7,010,929     ($ 3,600,108 )    $ 17,016,795     $ —       $ 805,668  


  Total Control and Affiliate Investments   $ 13,705,474     $ 7,010,929     ($ 3,600,108 )    $ 17,116,295     $ —       $ 805,668  


This schedule should be read in conjunction with the Corporation’s Consolidated Financial Statements, including the Consolidated Schedule of Portfolio Investments and Notes to the Consolidated Financial Statements.


(1)

Gross additions include increases in the cost basis of investments resulting from new portfolio investments, follow on investments, capitalized interest and the accretion of discounts. Gross additions also include net increases in unrealized appreciation or net decreases in unrealized depreciation, and the movement of an existing portfolio company into this category and out of another category.

(2)

Gross reductions include decreases in the cost basis of investments resulting from principal repayments, sales, note conversions, net increases in unrealized depreciation, net decreases in unrealized appreciation, the exchange of existing securities for new securities and the movement of an existing portfolio company out of this category and into another category.

(3)

Represents the total amount of interest, fees or dividends credited to income for the portion of the period an investment was included in Control or Affiliate categories, respectively.


53


Table of Contents

RAND CAPITAL CORPORATION AND SUBSIDIARIES

CONSOLIDATED SCHEDULE OF PORTFOLIO INVESTMENTS

December 31, 2017 (Continued)


Industry Classification

   Percentage of Total
Investments (at fair value)
as of December 31, 2017
 

Healthcare

     37.7

Software

     24.7  

Manufacturing

     19.4  

Professional Services

     7.7  

Consumer Product

     4.6  

Contact Center

     2.9  

Oil and Gas

     1.6  

Electronics

     1.1  

Marketing

     0.3  


Total Investments

     100


54


Table of Contents

RAND CAPITAL CORPORATION AND SUBSIDIARIES

FINANCIAL HIGHLIGHTS SCHEDULE

For the Five Years Ended December 31, 2018, 2017, 2016, 2015 and 2014


The following is a schedule of financial highlights for the years ended:


     2018     2017     2016     2015     2014  

Per Share Data:


Income from investment operations (1):


Investment income

   $ 0.33     $ 0.23     $ 0.16     $ 0.45     $ 0.40  

Expenses

     0.34       0.32       0.54       0.29       0.39  


Investment (loss) gain before income taxes

     (0.01     (0.09     (0.38     0.16       0.01  

Income tax (benefit) expense

     (0.00     (0.09     (0.13     0.02       0.01  


Net investment (loss) gain

     (0.01     (0.00     (0.25     0.14       0.00  

Purchase of treasury stock (2)

     0.00       0.00       0.00       0.00       0.02  

Net realized and unrealized (loss) gain on investments

     (0.05     (0.11     0.06       0.10       0.71  


(Decrease) increase in net asset value

     (0.06     (0.11     (0.19     0.24       0.73  

Net asset value, beginning of year, based on weighted average shares

     5.05       5.16       5.35       5.11       4.38  


Net asset value, end of year, based on weighted average shares

   $ 4.99     $ 5.05     $ 5.16     $ 5.35     $ 5.11  


Per share market value, end of year

   $ 2.50     $ 3.02     $ 3.16     $ 3.77     $ 4.09  


Total return based on market value

     (17.22 %)      (4.43 %)      (16.1 %)      (7.8 %)      33.2

Total return based on net asset value

     (1.24 %)      (2.18 %)      (3.62 %)      4.64     15.26

Supplemental Data:


Ratio of expenses before income taxes to average net assets

     6.92     6.23     10.23     5.49     8.27

Ratio of expenses including taxes to average net assets

     5.73     6.29     8.48     7.89     16.28

Ratio of net investment (loss) gain to average net assets

     (0.22 %)      (0.06 %)      (3.62 %)      2.55     0.07

Portfolio turnover

     7.4     18.1     18.4     21.4     21.5

Net assets end of year

   $ 31,524,187     $ 31,918,685     $ 32,629,363     $ 33,853,660     $ 32,353,441  

Weighted average shares outstanding, end of year

     6,321,988       6,321,988       6,325,792       6,328,538       6,391,175  


(1)

Per share data are based on shares outstanding and results are rounded.

(2)

Net increase is due to purchase of common stock at prices less than beginning of period net asset value per share.


55


Table of Contents

RAND CAPITAL CORPORATION AND SUBSIDIARIES

NOTES TO THE CONSOLIDATED FINANCIAL STATEMENTS


NOTE 1. - SUMMARY OF SIGNIFICANT ACCOUNTING POLICIES

Nature of Business - Rand Capital Corporation (“Rand”) was incorporated under the laws of New York in 1969. Beginning in 1971, Rand operated as a publicly traded, closed-end, diversified management company that was registered under Section 8 of the Investment Company Act of 1940 (the “1940 Act”). In 2001, Rand elected to be treated as a business development company (“BDC”) under the 1940 Act. In 2002, Rand formed a wholly-owned subsidiary for the purpose of operating it as a small business investment company (“SBIC”) licensed by the U.S. Small Business Administration (“SBA”). The subsidiary received an SBA license to operate as an SBIC in 2002. The subsidiary, which had been organized as a Delaware limited partnership, was converted into a New York corporation on December 31, 2008, at which time its operations as a licensed SBIC were continued by the newly formed corporation under the name of Rand Capital SBIC, Inc. (“Rand SBIC”). In 2012, the SEC granted an Order of Exemption for Rand with respect to the operations of Rand SBIC. At that time, although Rand SBIC was operated as if it were a BDC, it was registered as an investment company under the 1940 Act. Upon Rand’s receipt of the order granting the exemptions, Rand SBIC filed an election to be regulated as a BDC under the 1940 Act. The following discussion describes the operations of Rand and its wholly-owned subsidiary Rand SBIC (collectively, the “Corporation”).

Principles of Consolidation - The consolidated financial statements include the accounts of Rand and its wholly-owned subsidiary. All intercompany accounts and transactions have been eliminated in consolidation.

Fair Value of Financial Instruments – The carrying amounts reported in the consolidated statement of financial position of cash, interest receivable, accounts payable and accrued expenses approximate fair value because of the immediate or short-term maturity of these financial instruments.

Fair Value of SBA Debentures - In September 2018, the SBIC Funding Corporation completed a pooling of SBA debentures that have a coupon rate of 3.548%, excluding a mandatory SBA annual charge estimated to be 0.804%, resulting in a total estimated fixed rate for ten years of 4.352%. The carrying value of Rand’s SBA debentures is a reasonable estimate of fair value because their stated interest rates approximate current interest rates that are available for debt with similar terms.

Investment Classification – In accordance with the provisions of the 1940 Act, the Corporation classifies its investments by level of control. Under the 1940 Act “Control Investments” are investments in companies that the Corporation is deemed to “Control” if it owns more than 25% of the voting securities of the company or has greater than 50% representation on the company’s board. “Affiliate Investments” are companies in which the Corporation owns between 5% and 25% of the voting securities. “Non-Control/Non-Affiliate Investments” are those companies that are neither Control Investments nor Affiliate Investments.

Investments - Investments are valued at fair value as determined in good faith by the management of the Corporation and approved by the Board of Directors. The Corporation invests in loan instruments, debt instruments, and equity instruments. There is no single standard for determining fair value in good faith. As a result, determining fair value requires that judgment be applied to the specific


56


Table of Contents

RAND CAPITAL CORPORATION AND SUBSIDIARIES

NOTES TO THE CONSOLIDATED FINANCIAL STATEMENTS


facts and circumstances of each portfolio investment while employing a consistent valuation process. The Corporation analyzes and values each investment quarterly, and records unrealized depreciation for an investment that it believes has become impaired, including where collection of a loan or debt security or realization of the recorded value of an equity security is doubtful. Conversely, the Corporation will record unrealized appreciation if it believes that an underlying portfolio company has appreciated in value and, therefore, its equity securities have also appreciated in value. These estimated fair values may differ from the values that would have been used had a ready market for the investments existed and these differences could be material if the Corporation’s assumptions and judgments differ from results of actual liquidation events. (See Note 2 “Investments.”)

Qualifying Assets - All of the Corporation’s investments have been made in privately held small business enterprises, that were not investment companies, were principally based in the United States, and represent qualifying assets as defined by Section 55(a) of the 1940 Act.

Cash and Cash Equivalents - Temporary cash investments having a maturity of less than a year when purchased are considered to be cash equivalents.

Revenue Recognition - Interest Income - Interest income is recognized on the accrual basis except where the investment is in default or otherwise presumed to be in doubt. In such cases, interest is recognized at the time of receipt. A reserve for possible losses on interest receivable is maintained when appropriate.

Rand SBIC’s interest accrual is also regulated by the SBA’s “Accounting Standards and Financial Reporting Requirements for Small Business Investment Companies.” Under these rules, interest income cannot be recognized if collection is doubtful, and a 100% reserve must be established. The collection of interest is presumed to be in doubt when there is substantial doubt about a portfolio company’s ability to continue as a going concern or a loan is in default for more than 120 days. Management also uses other qualitative and quantitative measures to determine the value of a portfolio investment and the collectability of any accrued interest.

The following investments are on non-accrual status: G-TEC Natural Gas Systems (G-Tec) and a portion of the Mercantile Adjustment Bureau, LLC (Mercantile) outstanding loan balance.

The Corporation holds debt securities in its investment portfolio that contain payment-in-kind (“PIK”) interest provisions. PIK interest, computed at the contractual rate specified in each debt agreement, is periodically added to the principal balance of the debt and is recorded as interest income. Thus, the actual collection of this interest may be deferred until the time of debt principal repayment.

Revenue Recognition - Dividend Income – The Corporation may receive cash distributions from portfolio companies that are limited liability companies or corporations and these distributions are classified as dividend income on the consolidated statement of operations. Dividend income is recognized on an accrual basis when it can be reasonably estimated.

The Corporation may hold preferred equity securities that contain cumulative dividend provisions. Cumulative dividends are recorded as dividend income, if declared and deemed collectible,


57


Table of Contents

RAND CAPITAL CORPORATION AND SUBSIDIARIES

NOTES TO THE CONSOLIDATED FINANCIAL STATEMENTS


and any dividends in arrears are recognized into income and added to the balance of the preferred equity investment. The actual collection of these dividends in arrears may be deferred until such time as the preferred equity is redeemed.

Revenue Recognition - Fee Income – Primarily consists of the revenue associated with the amortization of financing fees charged to the portfolio companies upon successful closing of SBIC financings and income associated with portfolio company board attendance fees. The income associated with the amortization of financing fees was $41,872, $24,091 and $22,634 for the years ended December 31, 2018, 2017 and 2016, respectively and is estimated to be approximately $46,000 in 2019, $21,000 in 2020 and $6,000 in 2021. The board fees were $2,000, $1,000 and $4,000 for the years ended December 31, 2018, 2017 and 2016, respectively. In addition, we recorded a fee of approximately $142,000 for modifying a debt instrument during the year ended December 31, 2018.

Realized Gain or Loss and Unrealized Appreciation or Depreciation of Investments - Amounts reported as realized gains and losses are measured by the difference between the proceeds from the sale or exchange and the cost basis of the investment without regard to unrealized gains or losses recorded in prior periods. Proceeds held in escrow are reported in other assets. The cost of securities that have, in management’s judgment, become worthless are written off and reported as realized losses when appropriate. Unrealized appreciation or depreciation reflects the difference between the valuation of the investments and the cost basis of the investments.

Original Issue Discount – Investments may include “original issue discount”, or OID, income. This occurs, for example, when the Corporation purchases a warrant and a note from a portfolio company simultaneously, which requires an allocation of a portion of the purchase price to the warrant and reduces the purchase price allocated to the note by an equal amount in the form of a note discount or OID. The note is reported net of the OID and the OID is accreted into interest income over the life of the loan. The Corporation recognized $39,653, $32,129 and $9,996 in OID income for the years ended December 31, 2018, 2017 and 2016, respectively. OID income is estimated to be approximately $41,000 for 2019.

Deferred Debenture Costs - SBA debenture origination and commitment costs, which are netted against the debenture obligation (See Note 5 “SBA Debenture Obligations”), will be amortized ratably over the terms of the SBA debentures. Amortization expense was $27,400 for each of the years ended December 31, 2018, 2017 and 2016, respectively. Amortization expense on currently outstanding debentures for the next five years is estimated to average $29,000 per year.

Net Assets Per Share - Net assets per share are based on the number of shares of common stock outstanding. There are no common stock equivalents outstanding.

Supplemental Cash Flow Information - Income taxes refunded (paid) during the years ended December 31, 2018, 2017 and 2016 amounted to $26,448, ($486,769) and ($2,560,614), respectively. Interest paid during the years ended December 31, 2018, 2017 and 2016 was $282,875, $282,875 and $283,650, respectively. During 2018, 2017 and 2016, the Corporation converted $609,817, $269,445 and $19,252, respectively, of interest receivable and payment-in-kind (PIK) interest into debt investments. During the year ended December 31, 2016, the Corporation recorded one escrow receivable for $1,100,000 from the sale of Gemcor II LLC, which was collected during 2017. During the year ended December 31, 2016, the Corporation collected $1,510,248 in escrow receivable from BinOptics Corporation.


58


Table of Contents

RAND CAPITAL CORPORATION AND SUBSIDIARIES

NOTES TO THE CONSOLIDATED FINANCIAL STATEMENTS


Concentration of Credit and Market Risk – The Corporation’s financial instruments potentially subject it to concentrations of credit risk. Cash is invested with banks in amounts which, at times, exceed insured limits. Management does not anticipate non-performance by the banks.

As of December 31, 2018, 45% of the Corporation’s total investment value was held in debt and equity securities of five portfolio companies. As of December 31, 2017, 47% of the Corporation’s total investment value was held in debt and equity securities in five portfolio companies.

The following are the concentrations of the top five portfolio company values to the fair value of the Corporation’s total investment portfolio:


     December 31,
2018
 

Genicon, Inc. (Genicon)

     13

eHealth Global Technologies, Inc. (eHealth),

     10

ACV Auctions, Inc. (ACV)

     8

Tilson Technology Management, Inc. (Tilson)

     7

Microcision, LLC. (Microcision)

     7
     December 31,
2017
 

Genicon, Inc. (Genicon)

     12

eHealth Global Technologies, Inc. (eHealth),

     11

Rheonix, Inc. (Rheonix)

     9

Tilson Technology Management, Inc. (Tilson)

     8

Outmatch (Outmatch)

     7

Income Taxes - The Corporation reviews the tax positions it has taken to determine if they meet the “more likely than not threshold” for the benefit of the tax position to be recognized in the financial statements. A tax position that fails to meet the more likely than not recognition threshold will result in either a reduction of a current or deferred tax asset or receivable, or the recording of a current or deferred tax liability. (See Note 4 “Income Taxes.”)

Accounting Estimates - The preparation of financial statements in conformity with accounting principles generally accepted in the United States of America (GAAP) requires management to make estimates and assumptions that affect the reported amounts of assets and liabilities and disclosure of contingent assets and liabilities at the date of the financial statements and the reported amounts of revenues and expenses during the reporting period. Actual results could differ from those estimates.

SBA Debenture - The Corporation had $8,750,000 and $8,000,000 in outstanding SBA debentures at December 31, 2018 and December 31, 2017, respectively, with a weighted average interest rate of 3.58% as of December 31, 2018. The $8,750,000 in outstanding SBA debentures matures from 2022 through 2029.


59


Table of Contents

RAND CAPITAL CORPORATION AND SUBSIDIARIES

NOTES TO THE CONSOLIDATED FINANCIAL STATEMENTS


As a requirement of being licensed the SBA, Rand SBIC has accepted the SBA’s standard default language which states that Rand SBIC has consented to the exercise by the SBA of all rights of the SBA under 13 C.F.R. 107.1810(i) “SBA remedies for automatic events of default” and has agreed to take all actions that the SBA may so require, which may include automatic consent to the appointment of the SBA or its designee as receiver under Section 311(c) of the Small Business Investment Act of 1958.

NOTE 2. – INVESTMENTS

The Corporation’s investments are carried at fair value in accordance with Accounting Standards Codification (ASC) 820, “Fair Value Measurements and Disclosures”, which defines fair value, establishes a framework for measuring fair value in GAAP, and expands disclosures about fair value measurements.

Loan investments are defined as traditional loan financings with no equity features. Debt investments are defined as debt financings that include one or more equity features such as conversion rights, stock purchase warrants, and/or stock purchase options. A financing may also be categorized as a debt financing if it is accompanied by the direct purchase of an equity interest in a portfolio company.

The Corporation uses several approaches to determine the fair value of an investment. The main approaches are:


Loan and debt securities are valued at cost when it is representative of the fair value of the investment or sufficient assets or liquidation proceeds are expected to exist from a sale of a portfolio company at its estimated fair value. However, they may be valued at an amount other than cost given the carrying interest rate versus the related inherent portfolio risk of the investment. A loan or debt instrument may be reduced in value if it is judged to be of poor quality, collection is in doubt or insufficient liquidation proceeds exist.


Equity securities may be valued using the “asset approach”, “market approach” or “income approach.” The asset approach involves estimating the liquidation value of the portfolio company’s assets. This approach values the equity at the value remaining after the portfolio company pays of its debt and loan balances and its outstanding liabilities. The market approach uses observable prices and other relevant information generated by similar market transactions. It may include the use of market multiples derived from a set of comparables to assist in pricing the investment. Additionally, the Corporation adjusts valuations if a subsequent significant equity financing has occurred that includes a meaningful portion of the financing by a sophisticated, unrelated new investor. The income approach employs a cash flow and discounting methodology to value an investment.


60


Table of Contents

RAND CAPITAL CORPORATION AND SUBSIDIARIES

NOTES TO THE CONSOLIDATED FINANCIAL STATEMENTS


ASC 820 classifies the inputs used to measure fair value into the following hierarchy:

Level 1: Quoted prices in active markets for identical assets or liabilities, used in the Corporation’s valuation at the measurement date.

Level 2: Quoted prices for similar assets or liabilities in active markets, or quoted prices for identical or similar assets or liabilities in markets that are not active, or other observable inputs other than quoted prices.

Level 3: Unobservable and significant inputs to determining the fair value.

Financial assets are categorized based upon the level of judgment associated with the inputs used to measure their fair value. Any changes in estimated fair value are recorded in the consolidated statement of operations.

There were no Level 1 or 2 investments as of December 31, 2018.

In the valuation process, the Corporation values restricted securities, categorized as Level 3 investments, using information from these portfolio companies, which may include:


Audited and unaudited statements of operations, balance sheets and operating budgets;


Current and projected financial, operational and technological developments of the portfolio company;


Current and projected ability of the portfolio company to service its debt obligations;


The current capital structure of the business and the seniority of the various classes of equity if a deemed liquidation event were to occur;


Pending debt or capital restructuring of the portfolio company;


Current information regarding any offers to purchase the investment, or recent fundraising transactions;


Current ability of the portfolio company to raise additional financing if needed;


Changes in the economic environment which may have a material impact on the operating results of the portfolio company;


Internal circumstances and events that may have an impact (both positive and negative) on the operating performance of the portfolio company;


Qualitative assessment of key management;


Contractual rights, obligations or restrictions associated with the investment; and


Other factors deemed relevant by the Corporation’s management to assess valuation.

The valuation may be reduced if a portfolio company’s performance and potential have deteriorated significantly. If the factors that led to a reduction in valuation are overcome, the valuation may be readjusted.

Equity Securities

Equity securities may include preferred stock, common stock, warrants and limited liability company membership interests.


61


Table of Contents

RAND CAPITAL CORPORATION AND SUBSIDIARIES

NOTES TO THE CONSOLIDATED FINANCIAL STATEMENTS


The significant unobservable inputs used in the fair value measurement of the Corporation’s equity investments are earnings before interest, tax and depreciation and amortization (EBITDA) and revenue multiples, where applicable, the financial and operational performance of the business, and the debt and senior equity preferences that may exist in a deemed liquidation event. Standard industry multiples may be used when available; however, the Corporation’s portfolio companies are typically small and in early stages of development and these industry standards may be adjusted to more closely match the specific financial and operational performance of the portfolio company. Due to the nature of certain investments, fair value measurements may be based on other criteria, which may include third party appraisals. Significant changes in any of these unobservable inputs may result in a significantly higher or lower fair value estimate.

Another key factor used in valuing equity investments is a significant recent arms-length equity transaction entered into by the portfolio company with a sophisticated, non-strategic, unrelated, new investor. The terms of these equity transactions may not be identical to the equity transactions between the portfolio company and the Corporation, and the impact of the difference in transaction terms on the market value of the portfolio company may be difficult or impossible to quantify.

When appropriate the Black-Scholes pricing model is used to estimate the fair value of warrants for accounting purposes. This model requires the use of highly subjective inputs including expected volatility and expected life, in addition to variables for the valuation of minority equity positions in small private and early stage companies. Significant changes in any of these unobservable inputs may result in a significantly higher or lower fair value estimate.

For recent investments of less than one year old, the Corporation generally relies on the cost basis, which is deemed to represent the fair value, unless other fair value inputs are identified causing the Corporation to depart from this basis.

Loan and Debt Securities

The significant unobservable inputs used in the fair value measurement of the Corporation’s loan and debt securities are the financial and operational performance of the portfolio company, similar debt with similar terms with other portfolio companies, as well as the market acceptance for the portfolio company’s products or services. These inputs will likely provide an indicator as to the probability of principal recovery of the investment. The Corporation’s loan and debt investments are often junior secured or unsecured debt securities. Fair value may also be determined based on other criteria where appropriate. Significant changes to the unobservable inputs may result in a change in fair value.

For recent investments, the Corporation generally relies on the cost basis, which is deemed to represent the fair value, unless other fair value inputs are identified causing the Corporation to depart from this basis.


62


Table of Contents

RAND CAPITAL CORPORATION AND SUBSIDIARIES

NOTES TO THE CONSOLIDATED FINANCIAL STATEMENTS


The following table provides a summary of the significant unobservable inputs used to determine the fair value of the Corporation’s Level 3 portfolio investments as of December 31, 2018:


Investment Type

   Market
Approach
EBITDA
Multiple
     Market
Approach

Liquidation
Seniority
     Market
Approach
Revenue
Multiple
     Market
Approach
Transaction

Pricing
     Totals  

Non-Control/Non-Affiliate Equity

   $ —        $ 25      $ 2,645,496      $ 7,968,502      $ 10,614,023  


Non-Control/Non-Affiliate Debt

   $ 700,000        5,316,413        —          910,777        6,927,190  


Total Non-Control/Non-Affiliate

   $ 700,000      $ 5,316,438      $ 2,645,496      $ 8,879,279      $ 17,541,213  


Affiliate Equity

   $ 2,360,000      $ 22,841      $ 4,690,930      $ 2,545,754      $ 9,619,525  


Affiliate Debt

     1,933,353        —          3,385,586        2,087,627        7,406,566  


Total Affiliate

   $ 4,293,353      $ 22,841      $ 8,076,516      $ 4,633,381      $ 17,026,091  


Control Equity

   $ —        $ —        $ —        $ 99,500      $ 99,500  


Total Control

   $ —        $ —        $ —        $ 99,500      $ 99,500  


Total Level 3 Investments

   $ 4,993,353      $ 5,339,279      $ 10,722,012      $ 13,612,160      $ 34,666,804  


Range

     3.9X-7X        1X        1X-4.0X        Not Applicable     

Unobservable Input

     EBITDA Multiple        Asset Value        Revenue Multiple        Transaction Price     

Weighted Average

     5.3X        1X        2.6X        Not Applicable     

The following table provides a summary of the components of Level 1, 2 and 3 Assets Measured at Fair Value at December 31, 2018:


       Fair Value Measurements at Reported Date Using  

Description

   December 31,
2018
     Quoted Prices in
Active Markets for
Identical Assets

(Level 1)
     Significant
Observable Inputs
(Level 2)
     Other Significant
Unobservable
Inputs
(Level 3)
 

Loan investments

   $ 4,935,777      $  —        $  —        $ 4,935,777  

Debt investments

     9,397,979        —          —          9,397,979  

Equity investments

     20,330,048        —          —          20,330,048  


Total

   $ 34,666,804      $ —        $ —        $ 34,666,804  


63


Table of Contents

RAND CAPITAL CORPORATION AND SUBSIDIARIES

NOTES TO THE CONSOLIDATED FINANCIAL STATEMENTS


The following table provides a summary of changes in Assets Measured at Fair Value Using Significant Unobservable Inputs (Level 3) for the year ended December 31, 2018:


     Fair Value Measurements Using Significant
Unobservable Inputs (Level 3)
Venture Capital  Investments
 

Description

   Loan
Investments
     Debt
Investments
     Equity
Investments
    Total  

Ending Balance, December 31, 2017, of Level 3 Assets

   $ 3,550,000      $ 10,096,244      $ 18,637,818     $ 32,284,062  

Realized loss included in net change in net assets from operations:


First Wave Products Group, LLC (First Wave)

     —          (316,469      (22,000     (338,469

Intrinsiq Material, Inc. (Intrinsiq)

     —          —          (1,125,673     (1,125,673


Total Realized Losses

     —          (316,469      (1,147,673 ))      (1,464,142

Unrealized Gains and Losses included in net change in net assets from operations:


ACV Auctions, Inc. (ACV Auctions)

     —          —          2,494,551       2,494,551  

BeetNPath, LLC (Beetnpath)

     —          —          (388,723     (388,723

Empire Genomics, LLC (Empire Genomics)

     —          (901,360      —         (901,360

First Wave

     —          66,469        55,000       121,469  

Genicon, Inc. (Genicon)

     —          —          (82,500     (82,500

GiveGab, Inc. (Givegab)

     —          —          191,907       191,907  

G-TEC Natural Gas Systems (G-tec)

     —          —          (100,000     (100,000

Intrinsiq

     —          —          725,673       725,673  

KnowledgeVision Systems, Inc. (Knowledgevision)

     —          —          (300,000     (300,000

Mercantile Adjustment Bureau, LLC (Mercantile)

     —          (249,040      —         (249,040

Microcision LLC (Microcision)

     —          —          610,000       610,000  

OnCore Golf Technology, Inc. (Oncore Golf)

     —          —          (77,712     (77,712

Rheonix, Inc. (Rheonix)

     —          —          (735,999     (735,999

SOMS Technologies, LLC (SOMS)

     —          —          (528,348     (528,348


Total Unrealized Gains and Losses

     —          (1,083,931      1,863,849       779,918  

Purchases of Securities/Changes to Securities/Non-cash conversions:


BeetNPath, LLC (Beetnpath)

     —          262,627        —         262,627  

Centivo Corporation (Centivo)

     —          —          201,342       201,342  

Empire Genomics

     —          348,287        —         348,287  

Genicon, Inc. (Genicon)

     —          481,806        —         481,806  

GoNoodle, Inc. (GoNoodle)

     —          10,333        —         10,333  

Knowledgevision

     775,000        —          —         775,000  

Microcision LLC (Microcision)

     —          19,213        —         19,213  

Oncore Golf

     —          —          77,712       77,712  

SciAps, Inc. (Sciaps)

     —          —          250,000       250,000  

Tech 2000, Inc. (Tech 2000)

     610,777        —          —         610,777  

Tilson Technology Management, Inc. (Tilson)

     —          50,000        50,000       100,000  


Total Purchases of Securities/Changes to Securities/Non-cash conversions

     1,385,777        1,172,266        579,054       3,137,097  


64


Table of Contents

RAND CAPITAL CORPORATION AND SUBSIDIARIES

NOTES TO THE CONSOLIDATED FINANCIAL STATEMENTS


Repayments and Sale of Securities:


Empire Genomics

     —          (21,665      —          (21,665

Knoa Software, Inc. (Knoa)

     —          (48,466      —          (48,466


Total Repayments and Sale of Securities

     —          (70,131      —          (70,131

Transfers within Level 3

     —          (400,000      400,000        —    


Ending Balance, December 31, 2018, of Level 3 Assets

   $ 4,935,777      $ 9,397,979      $ 20,333,048      $ 34,666,804  


Change in unrealized depreciation on investments for the period included in changes in net assets


   $ 779,918  


Net realized loss on investments for the period included in changes in net assets


   ($ 994,295


The following table provides a summary of the significant unobservable inputs used to determine the fair value of the Corporation’s Level 3 portfolio investments as of December 31, 2017:


Investment

Type            

   Market
Approach
EBITDA
Multiple
     Market
Approach
Liquidation
Seniority
     Market Approach
Revenue Multiple
     Market
Approach
Transaction
Pricing
     Totals  

Non-Control/Non-Affiliate  Equity

   $  -        $  25      $  2,145,496      $  5,792,387      $  7,937,908  


Non-Control/Non-Affiliate Debt

     949,040        2,380,819        3,500,000        400,000        7,229,859  


Total Non-Control/Non-Affiliate

   $ 949,040      $  2,380,844      $ 5,645,496      $ 6,192,387      $  15,167,767  


Affiliate Equity

   $ 4,420,000      $ 22,841      $ 5,156,092      $ 1,001,477      $ 10,600,410  


Affiliate Debt

     5,767,919        —          98,466        550,000        6,416,385  


Total Affiliate

   $ 10,187,919      $ 22,841      $ 5,254,558      $ 1,551,477      $ 17,016,795  


Control Equity

   $ —        $ —        $ 99,500      $ —        $ 99,500  


Control Debt

     —          —          —          —          —    


Total Control

   $ —        $ —        $ 99,500      $ —        $ 99,500  


Total Level 3 Investments

   $ 11,136,959      $ 2,403,685      $ 10,999,554      $ 7,743,864      $ 32,284,062  


Range

     4X-9X        1X        0.5X-6.2X        Not Applicable     

Unobservable Input

     EBITDA Multiple        Asset Value        Revenue Multiple        Transaction Price     

Weighted Average

     5.8X        1X        2.3X        Not Applicable     


65


Table of Contents

RAND CAPITAL CORPORATION AND SUBSIDIARIES

NOTES TO THE CONSOLIDATED FINANCIAL STATEMENTS


The following table provides a summary of the components of Level 1, 2 and 3 Assets Measured at Fair Value on a Recurring Basis at December 31, 2017:


            Fair Value Measurements at Reported Date Using  

Description

   December 31,
2017
     Quoted Prices in
Active Markets for
Identical Assets

(Level 1)
     Significant
Observable Inputs
(Level 2)
     Other Significant
Unobservable
Inputs
(Level 3)
 

Loan investments

   $ 3,550,000      $ —        $ —        $ 3,550,000  

Debt investments

     10,096,244        —          —          10,096,244  

Equity investments

     18,637,818        —          —          18,637,818  


Total

   $ 32,284,062      $ —        $ —        $ 32,284,062  


The following table provides a summary of changes in Assets Measured at Fair Value on a Recurring Basis Using Significant Unobservable Inputs (Level 3) for the year ended December 31, 2017:


     Fair Value Measurements Using Significant
Unobservable Inputs (Level 3)
Venture Capital  Investments
 

Description

   Loan
Investments
     Debt
Investments
     Equity
Investments
    Total  

Ending Balance, December 31, 2016, of Level 3 Assets

   $ 3,200,000      $ 6,700,221      $ 17,600,260     $ 27,500,481  

Realized Loss included in net change in net assets from operations:


City Dining Cards, Inc. (Loupe)

     —          —          (500,000     (500,000


Total Realized Loss

     —          —          (500,000     (500,000

Unrealized Gains and Losses included in net change in net assets from operations:


ACV Auctions, Inc. (ACV Auctions)

     —          —          119,356       119,356  

BeetNPath, LLC (Beetnpath)

     —          —          29,723       29,723  

Carolina Skiff LLC (Carolina Skiff)

     —          —          650,000       650,000  

Intrinsiq Material, Inc. (Intrinsiq)

     —          —          (380,000     (380,000

Knoa Software, Inc. (Knoa)

     —          —          779,700       779,700  

Mercantile Adjustment Bureau, LLC (Mercantile)

     —          (250,000      —         (250,000

SciAps, Inc. (Sciaps)

     —          —          (554,710     (554,710

Teleservices Solutions Holdings, LLC (Teleservices)

     —          —          (395,398     (395,398


Total Unrealized Gains and Losses

     —          (250,000      248,671       (1,329


66


Table of Contents

RAND CAPITAL CORPORATION AND SUBSIDIARIES

NOTES TO THE CONSOLIDATED FINANCIAL STATEMENTS


Purchases of Securities/Changes to Securities/Non-cash conversions:


Beetnpath

     —          100,000        11,277       111,277  

Centivo Corporation (Centivo)

     —          100,000        —         100,000  

eHealth Global Technologies, Inc. (eHealth)

     2,000,000        —          —         2,000,000  

Empire Genomics, LLC (Empire Genomics)

     —          201,489        —         201,489  

Genicon, Inc. (Genicon)

     300,000        903,779        120,000       1,323,779  

GoNoodle, Inc. (GoNoodle)

     —          10,229        —         10,229  

KnowledgeVision Systems, Inc. (Knowledge Vision)

     50,000        —          —         50,000  

Mercantile

     —          108,350        —         108,350  

Microcision LLC (Microcision)

     —          22,176        —         22,176  

Sciaps

     —          —          274,274       274,274  

Tilson Technology Management, Inc. (Tilson)

     —          750,000        750,000       1,500,000  


Total Purchases of Securities/Changes to Securities/Non-cash conversions

     2,350,000        2,196,023        1,155,551       5,701,574  


Transfers within Level 3

     (2,000,000      1,450,000        550,000       —    

Transfers out of Level 3

     —          —          (416,664     (416,664


Ending Balance, December 31, 2017, of Level 3 Assets

   $ 3,550,000      $ 10,096,244      $ 18,637,818     $ 32,284,062  


Decrease in unrealized depreciation on investments for the period included in changes in net assets


  ($ 274,708


Net realized gain on investments for the period included in changes in net assets


  $ 138,240  


NOTE 3. - OTHER ASSETS

Other assets was comprised of the following at December 31:


     2018      2017  

Operating receivables

   $ 11,428      $ 3,204  

Equipment (net)

     262        2,490  

Dividend receivable

     —          37,160  


Total other assets

   $ 11,690      $ 42,854  


NOTE 4. - INCOME TAXES

Deferred tax assets and liabilities are recorded for temporary differences between the financial statement and tax bases of assets and liabilities using the tax rate expected to be in effect when the taxes are actually paid or recovered.

In December 2017, the Tax Cuts and Jobs Act (the “Act”) was signed into law. The Act decreases the U.S. corporate federal income tax rate from a maximum of 35% to a flat 21% effective January 1, 2018. The impact of the re-measurement on the Corporation’s net deferred tax asset, as of December 31, 2017, was approximately $346,000 in additional income tax expense. The Act also


67


Table of Contents

RAND CAPITAL CORPORATION AND SUBSIDIARIES

NOTES TO THE CONSOLIDATED FINANCIAL STATEMENTS


includes a number of other provisions including, among others, the elimination of net operating loss carrybacks and limitations on the use of future losses, the repeal of the Alternative Minimum Tax regime and the repeal of the domestic production activities deduction. These provisions are not expected to have a material effect on the Corporation. For the year ended December 31, 2018, approximately $164,000 of income tax benefit was recorded based on the additional tax benefit expected to be claimed on a capital loss carryback. At December 31, 2018, the Corporation has completed its accounting for the income tax effects of the Act.

The tax effect of the major temporary differences and carryforwards that give rise to the Corporation’s net deferred tax asset at December 31, 2018 and 2017 are approximately as follows:


     2018      2017  

Operations

   ($ 50,000    ($ 134,000

Investments

     504,000        638,000  

NOL & tax credit carryforwards

     145,000        91,000  

Valuation allowance

     (74,000      (43,000


Deferred tax asset, net

   $ 525,000      $ 552,000  


The major temporary differences cited above include differences in the book and tax bases of the Corporation’s portfolio company investments, as well as unrealized gains and losses on corporate investments that will be taxed when realized in future years. The Corporation assesses the recoverability of its deferred tax assets annually to determine if a valuation allowance is necessary. In performing this assessment, it considers estimated future taxable income and ongoing tax planning strategies. Based on this assessment, it was determined that a valuation allowance was necessary against the deferred tax asset relating to certain state net operating loss carryforwards (NOL).

The components of income tax expense (benefit) reported in the consolidated statements of operations are as follows for the years ended December 31:


     2018      2017      2016  

Current:


Federal

   ($ 411,509    ($ 490,730    $ 2,571,560  

State

     8,400        (104,556      374,290  


     (403,109      (595,286      2,945,850  


Deferred:


Federal

     110,426        601,777        (3,151,558

State

     (83,761      11,524        (374,792


     26,665        613,301        (3,526,350


Total

   ($ 376,444    $ 18,015      ($ 580,500


A reconciliation of the (benefit) expense for income taxes at the federal statutory rate to the expense reported is as follows:


     2018      2017      2016  

Net investment (loss) gain, realized gain and unrealized (loss) gain before income tax expense

   ($ 770,942    ($ 692,663    ($ 1,783,183


Expected tax (benefit) expense at statutory rate

   ($ 161,898    ($ 235,505    ($ 606,282

State - net of federal effect

     (57,110      (59,906      (2,586

Pass-through expense (benefit) from portfolio investment

     24,075        (3,536      31,213  

Dividend received deduction

     (13,946      (11,659      (15,368

Federal Act Rate Change

     (164,395      346,292        0  

Other

     (3,170      (17,671      12,523  


Total

   ($ 376,444    $ 18,015      ($ 580,500


68


Table of Contents

RAND CAPITAL CORPORATION AND SUBSIDIARIES

NOTES TO THE CONSOLIDATED FINANCIAL STATEMENTS


At December 31, 2018 and 2017, the Corporation had no federal net operating loss carryforwards or capital loss carryforwards. For state tax purposes, there were various state net operating loss carryforwards totaling $1,501,811 and $837,526 at December 31, 2018 and 2017, respectively. The related deferred tax asset has a valuation allowance of $74,000 and $43,000 at December 31, 2018 and 2017, respectively on the Pennsylvania net operating loss, which is not expected to be utilized. For state tax purposes the Corporation has a Georgia Employer’s Jobs Tax Credit carryforward of $49,619 and $40,081 at December 31, 2018 and 2017, respectively and this credit expires in the next five to ten years.

The Corporation is currently open to audit under the statute of limitations by the Internal Revenue Service for the years ended December 31, 2015 through 2018. In general, the Corporation’s state income tax returns are open to audit under the statute of limitations for the years ended December 31, 2015 through 2018.

It is the Corporation’s policy to include interest and penalties related to income tax liabilities in income tax expense on the Statement of Operations. In addition, the Corporation records uncertain tax positions in accordance with ASC 740, “Income Taxes”, (“ASC 740”). ASC 740 provides guidance for how uncertain tax positions should be recognized, measured, presented, and disclosed in the financial statements. The uncertain tax benefits for the years ended December 31, 2018, 2017 and 2016 were de minimus and no amounts were recorded for interest and penalties related to unrecognized tax positions for the years ended December 31, 2018, 2017, and 2016.

NOTE 5. - SBA DEBENTURE OBLIGATIONS

At December 31, 2018 and 2017, Rand SBIC had debentures payable to and guaranteed by the SBA totaling $$8,750,000 and 8,000,000, respectively. The weighted average interest rate at December 31, 2018 was 3.58%.

The debenture terms require semiannual payments of interest at annual interest rates ranging from 2.245% to 3.644%, plus an annual charge of 0.804%. The debentures have fixed interest rates and a 10 year maturity date. As of December 31, 2018, the Corporation had $5,250,000 in additional leverage available from the SBA.


69


Table of Contents

RAND CAPITAL CORPORATION AND SUBSIDIARIES

NOTES TO THE CONSOLIDATED FINANCIAL STATEMENTS


The debentures outstanding at December 31, 2018 will mature as follows:


Maturity Date

   Leverage  

2022

   $ 3,000,000  

2023

     2,500,000  

2024

     1,500,000  

2025

     1,000,000  

2029

     750,000  


Total Outstanding

   $ 8,750,000  


The Corporation is required to pre-pay a SBA commitment fee equal to 1% of the face amount of the SBA leverage reserved as a partial prepayment of the SBA’s nonrefundable 3% leverage draw fees. The Corporation paid a commitment fee of $60,000 to the SBA during the year ended December 31, 2018 to secure $6,000,000 in SBA leverage through September 30, 2023. In addition, the Corporation paid $18,188 in leverage draw down fees during the fourth quarter of 2018 in conjunction with the drawdown of $750,000 in SBA leverage. There were no commitment and leverage draw fees paid during the years ended December 31, 2017 and 2016.

Rand SBIC has consented to the exercise by the SBA of all rights of the SBA under 13 C.F.R. 107.1810(i) “SBA remedies for automatic events of default” and has agreed to take all actions that the SBA may so require, which may include an automatic consent to the appointment of SBA or its designee as receiver under section 311(c) of the Act.

Pursuant to Accounting Standard Update (ASU) 2015-03, the debt origination costs directly associated with the SBA debt obligations are presented as a direct deduction from the related debt liability.


     December 31,
2018
     December 31,
2017
 

Debentures guaranteed by the SBA

   $ 8,750,000      $ 8,000,000  

Less unamortized issue costs

     (195,557      (144,827


Debentures guaranteed by the SBA, net

   $ 8,554,443      $ 7,855,173  


NOTE 6. - STOCKHOLDERS’ EQUITY (NET ASSETS)

At December 31, 2018 and 2017, there were 500,000 shares of $10.00 par value preferred stock authorized and unissued.

On October 25, 2018, the Board of Directors extended the repurchase authorization for up to 1,000,000 shares of the Corporation’s outstanding common stock on the open market through October 25, 2019 at prices that are no greater than the then current net asset value. No shares were repurchased during the years ended December 31, 2018 or 2017. At December 31, 2018 and 2017 the total treasury shares held was 541,046 shares with a total cost of $1,469,105.


70


Table of Contents

RAND CAPITAL CORPORATION AND SUBSIDIARIES

NOTES TO THE CONSOLIDATED FINANCIAL STATEMENTS


Summary of change in equity accounts:


     Accumulated
Net Investment
Loss
     Undistributed Net
Realized Gain on

Investments
     Net Unrealized
Depreciation or
Appreciation on
Investments
 

Balance, December 31, 2016

   ($ 1,577,848    $ 27,127,054      ($ 2,718,831

Net (decrease) increase in net assets from operations

     (19,298      88,684        (780,064


Balance, December 31, 2017

     (1,597,146      27,215,738        (3,498,895

Net (decrease) increase in net assets from operations

     (68,406      (994,295      668,203  


Balance, December 31, 2018

   ($ 1,665,552    $ 26,221,443      ($ 2,830,692


NOTE 7. - STOCK OPTION PLANS

In 2001, the stockholders of the Corporation authorized the establishment of an Employee Stock Option Plan (the “Option Plan”) that provides for the award of options to purchase up to 200,000 common shares to eligible employees. In 2002, the Corporation placed the Option Plan on inactive status as it developed a new profit sharing plan for the Corporation’s employees in connection with the formation of its SBIC subsidiary. As of December 31, 2018, 2017 and 2016, no stock options had been awarded under the Option Plan. Because Section 57(n) of the 1940 Act prohibits maintenance of a profit sharing plan for the officers and employees of a BDC where any option, warrant or right is outstanding under an executive compensation plan, no options will be granted under the Option Plan while any profit sharing plan is in effect with respect to the Corporation (See Note 8. “Employee Benefit Plans”).

NOTE 8. - EMPLOYEE BENEFIT PLANS

The Corporation has a defined contribution 401(k) Plan (the “401K Plan”). The 401K Plan provides a base contribution of 1% for eligible employees and also provides up to 5% matching contributions. The employer contributions to the 401K Plan amounted to $45,990, $29,199 and $39,673 for the years ended December 31, 2018, 2017 and 2016, respectively.

In 2002, the Corporation established a Profit Sharing Plan (the “Plan”) for its executive officers in accordance with Section 57(n) of the 1940 Act. Under the Plan, the Corporation will pay its executive officers aggregate profit sharing payments equal to 12% of the net realized gains on investments of its SBIC subsidiary, net of all realized losses and unrealized depreciation on the investments of the SBIC subsidiary, for the fiscal year, computed in accordance with the Plan and the Corporation’s interpretation of the Plan. Any profit sharing paid or accrued cannot exceed 20% of the Corporation’s net income, as defined in the Plan. For purposes of the 20% profit sharing test, the Corporation interprets net income to be the total of the Corporation’s net investment (loss) gain and its net realized gain (loss) on sales and dispositions of investments, prior to inclusion of the estimated profit sharing obligation. The profit sharing payments are split equally between the Corporation’s two executive officers, each of whom is fully vested in the Plan.

The Corporation did not record any expense under the Plan for the years ended December 31, 2018 or 2017 and recorded $1,270,052 during the year ended December 31, 2016. Included in the profit sharing and bonus payable line on the accompanying consolidated statement of financial position at December 31, 2017 is $132,000 that was paid in 2018. Estimated payroll taxes and benefits on the profit sharing have been accrued. The amounts approved do not exceed the defined limits.


71


Table of Contents

RAND CAPITAL CORPORATION AND SUBSIDIARIES

NOTES TO THE CONSOLIDATED FINANCIAL STATEMENTS


NOTE 9. - COMMITMENTS AND CONTINGENCIES

The Corporation has a lease for office space which expires in December 2020. Rent expense under this operating lease for the years ended December 31, 2018, 2017 and 2016 was $20,100, $19,800 and $19,500, respectively. The operating lease obligations are approximately as follows:


Year

   Amount  

2019

     19,400  

2020

     19,700  


Total

   $ 39,100  


On March 2, 2017, the Corporation filed with the Securities and Exchange Commission (the “SEC”) certain Change in Control Agreements, which have been executed with each of its named executive officers, (“NEOs”), which provide each NEO with certain financial benefits in the event that (i) such NEO’s employment is terminated without cause (as defined in the Change in Control Agreement) in connection with, or within eighteen months after, a Change in Control (as defined in the Change in Control Agreement) of the Corporation or (ii) such NEO terminates his employment in connection with, or within eighteen months after, a Change in Control for good reason (as defined in the Change in Control Agreement). Upon the occurrence of such events, each Change in Control Agreement provides for a lump sum payment to the NEO in an amount equal to (i) one (1.0) times such NEO’s annual base salary then in effect plus (ii) the average of the annual incentive bonuses and profit sharing payments earned by such NEO for the last five fiscal years ended prior to such NEO’s employment termination date. However, the amount of the payment to any NEO cannot exceed (and will be reduced in order not to exceed) 1.5% of the total equity capitalization of the Corporation implied by the Change in Control event.

NOTE 10. - QUARTERLY OPERATIONS AND EARNINGS DATA – UNAUDITED


     4th
Quarter
     3rd
Quarter
     2nd
Quarter
    1st
Quarter
 

2018


Investment income

   $ 668,325      $ 662,302      $ 413,518     $ 362,809  

Net increase (decrease) in net assets from operations

   $ 936,511      ($ 179,302    ($ 631,294   ($ 520,413

Basic and diluted net increase (decrease) in net assets per share from operations

   $ 0.15      ($ 0.03    ($ 0.10   ($ 0.08

2017


Investment income

   $ 379,987      $ 397,019      $ 349,139     $ 328,637  

Net increase (decrease) in net assets from operations

   $ 226,209      $ 57,931      ($ 635,337   ($ 359,481

Basic and diluted net increase (decrease) in net assets per share from operations

   $ 0.04      $ 0.01      ($ 0.10   ($ 0.06


72


Table of Contents

RAND CAPITAL CORPORATION AND SUBSIDIARIES

NOTES TO THE CONSOLIDATED FINANCIAL STATEMENTS


NOTE 11. – ALLOWANCE FOR DOUBTFUL ACCOUNTS

The Corporation maintains an allowance for doubtful accounts for estimated uncollectible interest payments due from portfolio investments. The allowance for doubtful accounts is based on a review of the overall condition of the receivable balances and a review of past due amounts. Changes in the allowance for doubtful accounts consist of the following:


     2018      2017      2016  

Balance at beginning of year

   ($ 161,000    ($ 161,000    ($ 122,000

Provision for losses

     —          —          (39,000


Balance at end of year

   ($ 161,000    ($ 161,000    ($ 161,000


NOTE 12. – SUBSEQUENT EVENT

In January 2019 the Corporation entered into a stock purchase agreement to sell approximately 8.3 million shares of Rand’s common stock to East Asset Management, LLC for $25 million in cash and portfolio assets. Additionally, a new entity, Rand Capital Management, LLC will be established as an external management company and will be retained by Rand Capital to be its investment advisor. The sale and issuance of common stock pursuant to the stock purchase agreement as well as the externalization of the management structure are subject to shareholder and other regulatory approvals.

In connection with the anticipated closing of the above-described transactions and contingent upon meeting certain tax-related conditions, the Corporation intends to elect to become a regulated investment company (“RIC”) for U.S. federal tax purposes. This will enable the pass through of capital gains and investment income to shareholders without payment of corporate-level U.S. federal income tax by Rand.


73


Table of Contents

RAND CAPITAL CORPORATION AND SUBSIDIARY

SCHEDULE OF CONSOLIDATED CHANGES IN INVESTMENTS AT

COST AND REALIZED LOSS

For the Year Ended December 31, 2018


    Cost
Increase
(Decrease)
    Realized
Loss
 

New investments:


KnowledgeVision Systems, Inc. (Knowledgevision)

  $ 775,000     $ —    

Tech 2000, Inc. (Tech 2000)

    600,000       —    

BeetNPath, LLC (Beetnpath)

    262,627       —    

Genicon Inc. (Genicon)

    250,000       —    

SciAps, Inc. (Sciaps)

    250,000       —    

Centivo Corporation (Centivo)

    200,000       —    

Tilson Technology Management, Inc. (Tilson)

    100,000       —    

Empire Genomics, LLC (Empire Genomics)

    50,000       —    


Total of new investments

    2,487,627    

Other changes to investments:


Empire Genomics capitalized fee income and interest conversion

    298,287       —    

Genicon interest conversion and OID amortization

    231,806       —    

OnCore Golf Technology, Inc. (Oncore) interest conversion

    77,712       —    

Microcision LLC (Microcision) interest conversion

    19,213       —    

Tech 2000 interest conversion

    10,777       —    

GoNoodle, Inc. (GoNoodle) interest conversion

    10,333       —    

Centivo interest conversion

    1,342       —    


Total of other changes to investments

    649,470    

Investments repaid, sold or liquidated:


Intrinsiq Material, Inc. (Intrinsiq) realized loss

    (1,125,673     (1,125,673

First Wave Technologies, Inc. (First Wave) realized loss

    (338,469     (338,469

Knoa Software Inc. (Knoa) repayment

    (48,466     —    

Empire Genomics repayment

    (21,666     —    


Total of investments repaid, sold or liquidated

    (1,534,274     (1,464,142


Net change in investments, at cost

  $ 1,602,823     ($ 1,464,142


74


Table of Contents

Report of Independent Registered Public Accounting Firm

To the Stockholders and the Board of Directors of Rand Capital Corporation and Subsidiaries

Opinion on the Financial Statements

We have audited the accompanying consolidated statements of financial position, including the consolidated schedules of portfolio investments, of Rand Capital Corporation and Subsidiaries (the Corporation) as of December 31, 2018 and 2017, and the related consolidated statements of operations, changes in net assets and cash flows for each of the three years in the period ended December 31, 2018, and the related notes to the consolidated financial statements, and the financial highlights schedule for each of the five years in the period ended December 31, 2018 (collectively, the financial statements). In our opinion, the financial statements and financial highlights schedule present fairly, in all material respects, the financial position of Rand Capital Corporation and Subsidiaries as of December 31, 2018 and 2017, and the results of its operations and its cash flows for each of the three years in the period ended December 31, 2018, and the financial highlights for each of the five years in the period ended December 31, 2018 in conformity with accounting principles generally accepted in the United States of America.

Basis for Opinion

These financial statements and the financial highlights schedule are the responsibility of the Corporation’s management. Our responsibility is to express an opinion on the Corporation’s financial statements and financial highlights schedule based on our audits. We are a public accounting firm registered with the Public Company Accounting Oversight Board (United States) (PCAOB) and are required to be independent with respect to the Corporation in accordance with U.S. federal securities laws and the applicable rules and regulations of the Securities and Exchange Commission and the PCAOB.

We conducted our audits in accordance with the standards of the PCAOB. Those standards require that we plan and perform the audit to obtain reasonable assurance about whether the financial statements and financial highlights schedule are free of material misstatement, whether due to error or fraud. The Company is not required to have, nor were we engaged to perform, an audit of its internal control over financial reporting. As part of our audits we are required to obtain an understanding of internal control over financial reporting but not for the purpose of expressing an opinion on the effectiveness of the Corporation’s internal control over financial reporting. Accordingly, we express no such opinion.

Our audits included performing procedures to assess the risks of material misstatement of the financial statements and financial highlights schedule, whether due to error or fraud, and performing procedures that respond to those risks. Such procedures included examining, on a test basis, evidence regarding the amounts and disclosures in the financial statements and financial highlights schedule. Our audits also included evaluating the accounting principles used and significant estimates made by management, as well as evaluating the overall presentation of the financial statements and financial highlights schedule. Our procedures included confirmation of investments as of December 31, 2018 and 2017, by correspondence with portfolio companies and custodian(s); when replies were not received, we performed other auditing procedures. We believe that our audits provide a reasonable basis for our opinion.

As discussed in Note 2, the investment securities included in the financial statements valued at $34,666,804 (110% of net assets) and $32,284,062 (101% of net assets) as of December 31, 2018 and 2017, respectively, include securities valued at $34,666,804 and $32,284,062, respectively, whose fair values have been estimated by management in the absence of readily ascertainable fair value. The fair value estimates are then approved by the Board of Directors. We have reviewed the procedures used by management in preparing the valuations of investment securities and have inspected the underlying documentation, and in the circumstances we believe the procedures are reasonable and the documentation appropriate. Those estimated values may differ from the values that would have been used had a ready market for the investments existed.

The supplemental schedule of consolidated changes in investments at cost and realized gain for the year ended December 31, 2018 has been subjected to audit procedures performed in conjunction with the audit of the Corporation’s financial statements. The supplemental schedule is the responsibility of the Corporation’s management. Our audit procedures included determining whether the supplemental schedule reconciles to the financial statements or the underlying accounting and other records, as applicable and performing procedures


75


Table of Contents

to test the completeness and accuracy of the information presented in the supplemental schedule. In forming our opinion on the supplemental schedule, we evaluated whether the supplemental schedule, including its form and content, is presented in conformity with accounting principles generally accepted in the United States of America. In our opinion, the supplemental schedule of consolidated changes in investments at cost and realized gain for the year ended December 31, 2018 is fairly stated, in all material respects, in relation to the financial statements as a whole.

/s/ FREED MAXICK CPAs, P.C.

We have served as the Corporation’s auditor since 2003.

Buffalo, New York

March 7, 2019


76


Table of Contents
Item 9.

Changes in and Disagreements with Accountants on Accounting and Financial Disclosure

None


Item 9A.

Controls and Procedures

Disclosure Controls and Procedures. The Corporation maintains disclosure controls and procedures that are designed to ensure that information required to be disclosed in reports that it files or submits under the Securities Exchange Act of 1934, as amended, is recorded, processed, summarized, and reported within the time periods specified in the SEC’s rules and forms, and that this information is accumulated and communicated to management, including the Chief Executive Officer and the Chief Financial Officer, as appropriate, to allow timely decisions regarding required disclosure. The Chief Executive Officer and the Chief Financial Officer carried out an evaluation of the effectiveness of the design and operation of the Corporation’s disclosure controls and procedures as of December 31, 2018. Based on the evaluation of these disclosure controls and procedures, the Chief Executive Officer and Chief Financial Officer concluded that the Corporation’s controls and procedures were effective as of December 31, 2018.

Management Report on Internal Control Over Financial Reporting. The management of the Corporation is responsible for establishing and maintaining adequate internal control over financial reporting. The Corporation’s internal control system is a process designed to provide reasonable assurance to the Corporation’s management and board of directors regarding the preparation and fair presentation of published financial statements.

Management assessed the effectiveness of the Corporation’s internal control over financial reporting as of December 31, 2018. In making this assessment, management used the criteria set forth by the Committee of Sponsoring Organizations of the Treadway Commission in Internal Control-Integrated Framework (2013). Based on its assessment, management believes that, as of December 31, 2018, the Corporation’s internal control over financial reporting is effective.

This annual report does not include an attestation report of the Corporation’s independent registered public accounting firm regarding internal control over financial reporting. Management’s report was not subject to attestation by the Corporation’s independent registered public accounting firm pursuant to rules of the SEC that permit the Corporation to provide only management’s report in this Annual Report.

Changes in Internal Control over Financial Reporting. There have been no changes in our internal control over financial reporting during the Corporation’s most recent fiscal quarter that have materially affected, or are reasonably likely to materially affect, the Corporation’s internal control over financial reporting.


Item 9B.

Other Information

None


77


Table of Contents

Part III


Item 10.

Directors, Executive Officers, and Corporate Governance

Information regarding Directors and Executive Officers

The following table provides information concerning all persons who are Directors or executive officers of Rand. Rand is not part of a fund complex.


Name, Age and

Address            


Position(s)

held with

Fund


Length

of

Time Served as a

Director (1)


Business Experience and Occupations

During Last Five Years


Other

Directorships (2)

Directors who are Interested Persons (3)            

Allen F. Grum

(61)

c/o 2200 Rand Building Buffalo NY 14203

   President and Chief Executive Officer of Rand and a Director    1996    President and Chief Executive Officer since 1996. Prior thereto, Mr. Grum served as Senior Vice President of Rand Capital Corporation commencing in June 1995. From 1994 to 1995, Mr. Grum was Executive Vice President of Hamilton Financial Corporation and from 1991-1994 he served as Senior Vice President of Marine Midland Mortgage Corporation. Mr. Grum serves on a number of Boards of Directors of companies in which Rand Capital Corporation has an investment. His in-depth knowledge of Rand Capital Corporation’s operations, and the industries in which the Corporation operates makes Mr. Grum qualified to serve as a Director.    None

Directors who are not

Interested Persons


Erland E. Kailbourne

(77)

c/o 2200 Rand Building

Buffalo, NY 14203

   Director and Chair of the Board    1999    Director of Albany International Corporation since May 2009. From May 2009 until February 2019, Mr. Kailbourne was Chairman of Albany International Corporation. From January 2006 until May 2010, Mr. Kailbourne was Chairman of Financial Institutions, Inc. and its subsidiary Five Star Bank. He retired as Chairman and Chief Executive Officer (New York Region) of Fleet National Bank, a banking subsidiary of Fleet Financial Group, Inc., in 1998. From 1995 to 2000, he was Vice Chairman State University of New York (SUNY). He was Chairman and Chief Executive Officer of Fleet Bank, also a subsidiary of Fleet Financial Group, Inc., from 1993 until its merger into Fleet National Bank in 1997. He is a Director of REV LNG, LLC, Albany International Corporation, Allegany Co-op Insurance Company, Conemaugh Valley Insurance Company, and The Thomas and Laura Moogan Foundation. Mr. Kailbourne’s extensive banking and financial experience provide necessary attributes as a Director of Rand.   

Director of

Albany International Corporation


78


Table of Contents

Ross B. Kenzie

(87)

1961 Wehrle Drive

Suite 5

Buffalo, NY 14221

   Director    1996    Mr. Kenzie has been retired since 1989. Prior thereto, he was the Chairman of the Board and Chief Executive Officer of Goldome Bank, Buffalo, NY, a savings bank, from 1980. Prior thereto, Mr. Kenzie was Executive Vice President and Director of Merrill Lynch, Pierce, Fenner & Smith as well as Merrill Lynch & Co. Mr. Kenzie is a former Director of Biophan Technologies, Inc. and Natural Nano, Inc., development companies specializing in highly marketable business devices and naturally occurring nanotube technologies; and a former Director of Merchants Mutual Insurance Company. Mr. Kenzie is a former Director of Chicago Board of Options Exchange (CBOE). Mr. Kenzie’s banking and financial experience in addition to his involvement with emerging companies, provide invaluable expertise as a Director of Rand.    None

Jayne K. Rand

(58)

c/o 2200 Rand Building

Buffalo, NY 14203

   Director    1989    Since 1993, Miss Rand has been a Vice President of M&T Bank. Miss Rand’s banking experience and credit underwriting abilities provide necessary expertise as a Director of Rand.    None

Robert M. Zak

(61)

250 Main Street

Buffalo, NY 14202

   Director and Vice Chair of the Board    2005    Since 1995, Mr. Zak has been President and Chief Executive Officer of Merchants Mutual Insurance Company, which operates under the trade name Merchants Insurance Group. Mr. Zak joined Merchants in 1985. Prior to that his career was in public accounting. Mr. Zak served as a director of Manning & Napier, Inc. from November 2011 until June 2016. Mr. Zak’s executive leadership and public accounting experience provide desirable attributes as a Director of Rand.    None
Non-Director Executive Officers (3)            

Daniel P. Penberthy

(56)

c/o 2200 Rand Building

Buffalo, NY 14203

   Executive Vice President, Treasurer and Chief Financial Officer of Rand    N/A    Mr. Penberthy has served as Treasurer of Rand since August 1997. Since January 2002, Mr. Penberthy has served as Executive Vice President, and he has continued to serve as the Chief Financial Officer since 1997. From 1993 to 1997, Mr. Penberthy served as Chief Financial Officer for both the Greater Buffalo Partnership (formerly the Chamber of Commerce) and the Greater Buffalo Convention and Visitors Bureau. Prior thereto, from 1990 to 1993, Mr. Penberthy was employed by Greater Buffalo Development Foundation and KPMG.    None


(1)

Indicates initial year in which such person became a Director. All Directors’ terms of office will be through the next annual meeting of shareholders and until their successors have been duly elected and qualified.


79


Table of Contents
(2)

Indicates current directorships of companies with a class of equity securities registered under Section 12 of the Exchange Act, subject to the requirements of Section 15(d) of the Exchange Act, or registered as an investment company under the 1940 Act.

(3)

Indicates an executive officer of Rand, who is deemed to be an “interested person” under Section 2(a)(19) of the 1940 Act.

Committee Information

The Committees of the Board of Directors have the following members:


Compensation Committee


Governance and

Nominating Committee


Audit Committee

Robert M. Zak (Chair)    Erland E. Kailbourne (Chair)    Ross B. Kenzie (Chair)
Erland E. Kailbourne    Ross B. Kenzie    Erland E. Kailbourne
Jayne K. Rand    Jayne K. Rand    Robert M. Zak

Compensation Committee

The Compensation Committee is comprised of independent Board members, each of whom meet the independence requirements of the Nasdaq Stock Market and applicable law, and advises the independent members of the Board with respect to the compensation of the executive officers and reviews the criteria that form the basis for management compensation. None of the persons on the Compensation Committee are “interested persons” as defined in Section 2(a)(19) of the 1940 Act.

The compensation levels of Rand’s President/CEO and Executive Vice President/CFO were recommended by Rand’s Compensation Committee and approved by the independent members of the Board, which represents a majority of its membership.

The Compensation Committee’s charter may be accessed at Rand’s website, www.randcapital.com.


80


Table of Contents

Governance and Nominating Committee

The primary purposes of the Governance and Nominating Committee include:


developing, recommending to the Board and assessing corporate governance policies for Rand;


overseeing the evaluation of the Board and its committees; and


recommending to the Board the individuals qualified to serve on the Board for election by shareholders at each annual meeting of shareholders, and recommending to the Board candidates to fill vacancies on the Board.

The Governance and Nominating Committee’s charter may be accessed at Rand’s website, www.randcapital.com. None of the persons on the Governance and Nominating Committee are “interested persons” as defined in Section 2(a)(19) of the 1940 Act. The Governance and Nominating Committee is comprised of members each of whom meet the independence requirements of the Nasdaq Stock Market.

Audit Committee

The Board of Directors has determined that none of the members of the Audit Committee are “interested persons” as defined in Section 2(a)(19) of the 1940 Act. The Audit Committee is comprised of independent Directors, all of whom meet the independence requirements of the Nasdaq Stock Market and the rules of the SEC. The Board has determined that Ross B. Kenzie is an audit committee financial expert (as defined by SEC regulations) (see Mr. Kenzie’s relevant work experience is described in the table above under “Information regarding Directors and Executive Officers”) and each of the other members of the Audit Committee also have qualifications and experience to be considered financial experts.

The Audit Committee’s charter may be accessed at Rand’s website, www.randcapital.com. The Audit Committee reviews the scope and results of the annual audit, receives reports from Rand’s independent registered public accountants, and reports the Audit Committee’s findings and recommendations to the Board.

The Audit Committee has adopted necessary reporting procedures for the confidential submission, receipt, retention and treatment of accounting and auditing complaints.

Factors used in the Audit Committee’s Assessment of the External Auditor Qualifications and Work Quality:

The Audit Committee is responsible for appointment, compensation and oversight of external auditors.

The Audit Committee annually reviews the Corporation’s independent public registered accountants’ (the “audit firm”) performance and independence in deciding whether to continue to retain such audit firm. In the course of these reviews, the Audit Committee considers, among other things:


The quality and efficiency of the audit firm’s historical and recent audit plans.


81


Table of Contents
   

The audit firm’s capabilities and expertise in handling the breadth and complexity of private equity accounting, portfolio valuation and public company reporting.


The desired balance of the audit firm’s experience and the fresh perspective occasioned by mandatory audit partner rotation every five years, and the audit firm’s periodic rotation of other audit management.


Public Company Accounting Oversight Board (PCAOB) reports on the audit firm, if any.


The appropriateness of the audit firm’s fees, which the Audit Committee evaluates, reviews and approves.


The effectiveness of the audit firm’s communications and working relationships with the Audit Committee and management.


The audit firm’s independence and objectivity.


The audit firm’s tenure, having served as the Corporation’s independent registered public accounting firm since 2003.


Evaluation of the audit by management and the Audit Committee.

The Audit Committee considers non-audit fee/services provided when assessing auditor independence.

Code of Conduct and Business Ethics

Our Code of Conduct and Business Ethics policy each requires that all employees and Directors avoid conflicts of interests that interfere with the performance of their duties or the best interests of the Corporation. The Business Ethics policy includes additional procedures modeled on Rule 17j-1 under the 1940 Act to prevent employees and Directors from abusing their access to information about the Corporation’s investments.

Rand has adopted a Code of Conduct that applies to Rand’s Chief Executive Officer, Chief Financial Officer and Vice President of Finance, and a Business Ethics Policy applicable to Rand’s Directors, officers and employees. The Code of Conduct and the Business Ethics Policy are each available in the Governance section of Rand’s website at www.randcapital.com.

They are also available in print to any shareholder who requests it. Rand will disclose any substantive amendments to, or waiver from provisions of, the Code of Conduct made with respect to the Chief Executive Officer, Chief Financial Officer or Vice President of Finance on its website.


82


Table of Contents

Section 16(a) Beneficial Ownership Reporting Compliance

Section 16(a) of the Exchange Act requires Rand’s Directors and executive officers, and persons who own more than ten percent of Rand’s shares, to file with the SEC initial reports of stock ownership and reports of changes to stock ownership. Reporting persons are required by SEC regulations to furnish Rand with all Section 16(a) reports that they file.

To our knowledge, based solely on review of the copies of such reports furnished to Rand and written representations that no other reports were required, Rand believes all Section 16(a) filing requirements applicable to its executive officers, Directors and greater than ten percent beneficial owners of Rand’s shares were complied with during the year ended December 31, 2018.


Item 11.

Executive Compensation

Compensation Discussion and Analysis

Rand’s principal executive officer is its President/Chief Executive Officer, Allen F. Grum, and Rand’s principal financial officer is its Executive Vice President/Chief Financial Officer, Daniel P. Penberthy. They are Rand’s Named Executive Officers (“NEOs”).

The President/Chief Executive Officer and Executive Vice President/Chief Financial Officer serve as the Management and Investment Committee of Rand SBIC, and are parties to a Profit Sharing Plan (the “Profit Sharing Plan”) of Rand SBIC that was adopted by Rand as a requirement for the licensing of Rand SBIC as a SBIC by the SBA.

The Compensation Committee, all of the members of which are independent Directors of the Board, makes determinations and recommendations to the Board with respect to the compensation of the NEOs. Each member (i) satisfies all of the independence requirements under the current rules and guidelines of the Nasdaq Stock Market, (ii) is an “outside Director” (as defined in the regulations pursuant to Section 162(m) of the IRS Code), and (iii) are non-employee Directors (as defined in Rule 16b-3 of the Exchange Act). The Compensation Committee’s responsibilities and authority are set forth in the Compensation Committee charter, which is disclosed on Rand’s website. The Compensation Committee recommendations are then reviewed by the independent Directors of the Board, who are responsible for establishing such compensation. Rand’s President and Chief Executive Officer is responsible for establishing the compensation of Rand’s staff other than the NEOs.

Introduction

This Compensation Discussion and Analysis is designed to provide shareholders with an understanding of our compensation philosophy and objectives as well as the analysis that was performed in setting executive compensation. It discusses the Compensation Committee’s determination of how and why, in addition to what, compensation actions were taken with respect to the NEOs.


83


Table of Contents

Objectives of Rand’s Compensation Programs and What they are Designed to Reward

Rand depends on the management and analytical abilities of its NEOs for its long-term success and the enhancement of long-term shareholder value. The objectives of Rand’s compensation programs are to provide appropriate levels of compensation, reward above average corporate performance, recognize individual initiative and achievement, attract and retain qualified individuals to contribute to Rand’s success, and motivate management to enhance shareholder value.

Key Elements of Rand’s Compensation Plans and Why they are Paid:


Base Salary – Base salaries meet the objectives of attracting and retaining the management talent needed to operate the business successfully. Individual salary amounts are not determined by formulas, but instead reflect the Compensation Committee’s judgment with respect to each NEO’s responsibility, performance, experience and past compensation, internal equity considerations and other factors, including NEO retention. Annually, the Board, on recommendation of the Compensation Committee, sets base salaries for the NEOs that it believes are appropriate given the scope of their duties and responsibilities.


Bonus – Rand provides the opportunity to earn bonuses to its NEOs and staff to motivate them to achieve results that exceed the annual budget and provide value to the Corporation. A bonus, if any, is based on a qualitative consideration of individual and Corporation performance. For purposes of determining whether a bonus was warranted for 2018 performance, the Compensation Committee considered the Corporation’s operating performance, the price performance of the Corporation’s common shares, the change in the Net Asset Value per share and the accomplishments of each officer during the year, including the achievement of strategic initiatives. The Compensation Committee considers, and may make appropriate adjustments for, unusual items that are deemed to be outside the control of the NEOs. Based upon the Compensation Committee’s analysis, a $50,000 bonus was awarded to each of the NEOs for 2018 to reflect the progress on the strategic initiatives, SBA approval, increase in interest income and the proposed transaction with East Asset Management.


Profit Sharing Plan – Rand provides long-term incentives to its NEOs through the Profit Sharing Plan, which allows them to participate in the growth of Rand’s portfolio and aligns their interests with those of Rand’s shareholders. The terms of Rand’s license to operate Rand SBIC require that it maintain a profit sharing plan, which provides for payment by Rand of designated percentages of net realized capital gains (net of all realized capital losses and unrealized depreciation) of Rand SBIC. Amounts paid or accrued pursuant to the Profit Sharing Plan cannot exceed 20% of Rand’s net income in a given year. The Compensation Committee does not have discretion to change the amounts due under the Profit Sharing Plan. For 2018, no amounts were accrued nor paid pursuant to the Profit Sharing Plan and as a result, no amounts are expected to be paid in 2019 pertaining to 2018 portfolio exits.


84


Table of Contents
   

Equity – Although we believe that equity ownership by management enhances shareholder value, restrictions imposed by the 1940 Act preclude Rand from offering stock options or other equity incentives to its NEOs at any time when they participate in a profit sharing plan. The Compensation Committee believes that each of the NEOs own shares in Rand that are significant to their respective net worth.


Standard Employee Benefits – Rand provides employee benefits it considers competitive and necessary to attract and retain talented personnel. Rand maintains a 401(k) plan for its employees under which participants may elect to contribute up to 20% of their compensation on a pretax basis, to a maximum of $18,500 ($24,500 if age 50 or over) for 2018. Rand makes a contribution of 1% of compensation for each participant and matches participant contributions up to 5% of compensation, subject to IRS annual compensation and contribution limits. Rand may also elect to contribute discretionary amounts under the 401(k) plan as determined by the Board. No discretionary amounts have been contributed since the 401(k) plan’s inception. Rand also provides life insurance, automobile reimbursement and club membership benefits to its NEOs.

Consideration of Prior Shareholder Advisory Vote on Executive Compensation

At our 2019 Annual Meeting of Shareholders, we will provide our shareholders the opportunity to vote to approve, on an advisory basis, the compensation of our NEOs. At the 2018 Annual Meeting of Shareholders, our shareholders cast 1,418,622 votes, or 95%, in favor of approving the compensation of our NEOs and 58,972 votes, or 4%, against approving such compensation, with 16,694 votes, or 1%, abstaining. Our Compensation Committee and Board value the opinions expressed by our shareholders, including the non-binding advisory vote on executive compensation. We are mindful of the strong support our shareholders expressed for our philosophy of seeking to link compensation to our operating and strategic objectives and the enhancement of shareholder value. As a result, our Compensation Committee took the results of the advisory vote on executive compensation into account in determining that our 2018, and anticipated 2019, executive compensation policies remain consistent with our policies in prior years and should continue to emphasize the performance, alignment, and retention objectives described above.

How the Amounts of Each Element of the Compensation are Determined and How They Fit Into Rand’s Overall Compensation Objectives

Salary, Bonus and Profit Sharing

The Compensation Committee determined that the amount of the base salary paid to each of the NEOs for 2018 was in the best interests of shareholders. A discretionary bonus payment was paid for 2018 to each of the NEOs for the reasons noted previously. The NEOs did not earn a profit sharing payment under the Profit Sharing Plan in 2018. In making its determination regarding compensation for each of the NEOs, the Compensation Committee considered whether the salaries, bonuses and profit sharing amounts due to its NEOs were consistent with the compensation philosophy described above.


85


Table of Contents

The Analysis Used in Setting Compensation Levels

When making individual compensation decisions for NEOs, the Compensation Committee takes many factors into account, including the individual’s role and responsibilities, performance, and experience; the overall performance of Rand; the recommendations of Board committee chairs; the individual’s past compensation; and a comparison to the other NEO of Rand. The Compensation Committee may engage a compensation consultant to provide insight into setting compensation levels.

Specifically, the Compensation Committee has considered factors such as:


total compensation in relation to Rand’s size, and the composition and performance of its investments and total investment capital available;


Rand’s success in identifying appropriate investment opportunities and returns on its investments;


the value of Rand’s assets in accordance with Accounting Standards Codification 820 “fair value measurement”;


the responsibilities and duties of the NEOs;


whether there has been any adjustment or potential recovery of prior payments resulting from the restatement of prior performance measures upon which bonus or profit sharing awards were based (no such adjustments or recovery occurred during 2016, 2017 or 2018); and


realized income from investment exits in the consolidated Rand and Rand SBIC portfolios.

Evaluating Performance

The Compensation Committee evaluates the performance of the NEOs annually, and consults with the other Directors and committee chairs regarding that performance. The Compensation Committee also seeks the advice of the President and Chief Executive Officer in connection with the performance evaluation for the other NEO; however, the President and Chief Executive Officer is not present when the Compensation Committee meets to evaluate his performance and recommend compensation for the NEOs.

The Compensation Committee uses discretion in qualitatively evaluating individual performance and considers the following factors, among others, in recommending to the Board any annual bonus awards to the NEOs: the input of other Board Committee Chairs, and each NEO’s contribution to Rand’s leadership, management, strategic planning, business development, and investment returns.

Change in Control Agreements

The Corporation and the Board believe that maintaining a Change in Control Agreement with each of our NEOs is in the best interest of the Corporation and its


86


Table of Contents

shareholders as it will assist in retaining our leadership in the event of a change in control and provides our NEOs with reasonable financial security in the case of a loss of employment resulting from a change in control. The Corporation and the Board believe that it is in the best interest of the Corporation and its shareholders to have the dedication of our NEOs, without the distraction of personal uncertainties that can result from a change in control. In addition, the Corporation believes the Change in Control Agreements help the Corporation maintain a competitive compensation program and encourages retention of the NEOs.

The Change in Control Agreement provides each NEO with a right to receive certain payments in the event that (i) such NEO’s employment is terminated without cause (as defined in the Change in Control Agreement) (other than for death or disability (as defined in the Change in Control Agreement)) in connection with, or within eighteen months after, a Change in Control of the Corporation or (ii) such NEO terminates his employment in connection with, or within eighteen months after, a Change in Control for “Good Reason”, which is defined in the Change in Control Agreements as (i) a change in the location at which such NEO performs his duties for the Corporation to a new location that is at least 50 miles from the prior location; (ii) a material decrease in the NEO’s authority, duties or responsibilities; (iii) a reduction in the NEO’s annual base salary or (iv) a reduction in the NEO’s annual bonus and profit sharing opportunity as compared to the opportunity for the prior fiscal year. As defined in more detail in the Change in Control Agreements, a “Change in Control” means the occurrence of any of the following events: (1) any person or entity becomes the beneficial owner, directly or indirectly, of securities representing more than 50% of the total voting power of the Corporation’s outstanding securities; (2) a merger or consolidation of the Corporation, other than one that results in the outstanding voting securities of the Corporation prior to such merger or consolidation representing at least 50% of the total voting power after such merger or consolidation; (3) the sale or disposition by the Corporation of all or substantially all of the Corporation’s assets or (4) a change in the composition of the Board that results in fewer than a majority of the Directors being Incumbent Directors (as defined in the Change in Control Agreements).

Upon the occurrence of such events, the Change in Control Agreements provide for a lump sum payment to the NEO from the Corporation in an amount equal to (i) the NEO’s annual base salary then in effect plus (ii) the average of the annual incentive bonus amounts and profit sharing payments earned by the NEO for the last five fiscal years ended prior to the NEO’s employment termination date. However, the amount of this payment per NEO cannot exceed (and will otherwise be reduced in order not to exceed) 1.5% of the total equity capitalization of the Corporation implied by the Change in Control event. Prior to receipt of such payment, the Change in Control Agreements require the NEO to execute a general release agreement, which includes a general release of claims against the Corporation by the NEO and agreements by the NEO to comply with ongoing confidentiality and non-disparagement obligations.

The term of the Change in Control Agreements commenced on March 1, 2017 and shall continue in effect until December 31, 2019, with subsequent automatic extensions of the term for one (1) additional year, unless, not later than nine months prior to the conclusion of any term, the Corporation or the NEO provides notice to the other not to extend the term. Under the terms of the proposed East Asset Management transaction, the Change of Control Agreements will be cancelled without any payment due or payable to the NEOs.


87


Table of Contents

For each of the NEOs, the table below estimates the amount that each such NEO would be paid under the Change in Control Agreements if a Change in Control of the Corporation occurs and such NEO is terminated without cause or voluntarily terminates his employment for Good Reason in connection with, or within eighteen months after, the occurrence of the Change in Control event. The amounts below assume that each employment termination was effective as of December 31, 2018.


Name

   Current Annual Base
Salary
     Five Year Average of
Annual Incentive
Bonus and Profit
Sharing Payments(1)
     Total Payment
Amount(2)
 

Allen F. Grum

   $ 245,000      $ 227,005      $ 472,005  

Daniel P. Penberthy

   $ 230,000      $ 227,005      $ 457,005  


(1)

Annual incentive bonus and profit sharing payments are computed using an average of the annual incentive bonus amount and profit sharing payments for the prior five completed fiscal years.

(2)

Assumes that the total amount of such payment to a NEO does not exceed 1.5% of the total equity capitalization of the Corporation as implied by a hypothetical Change in Control event. In the event that the total payment amount would be greater than 1.5% of the total equity capitalization implied by the Change in Control event, the amount of such payment will be reduced in order not to exceed 1.5% of the total equity capitalization implied by the Change in Control event.

Accounting and Tax Treatments of Compensation

The Compensation Committee’s policy is to structure compensation in a way that allows it to be fully tax deductible, where doing so will further the purposes of the executive compensation programs. The Compensation Committee also considers it important to retain flexibility to design compensation programs that recognize a full range of criteria important to Rand’s success, even where compensation payable under the programs may not be fully tax deductible.

Compensation Consultant

During 2018, the Corporation did not utilize a compensation consultant. The Compensation Committee anticipates that it may use an independent advisor periodically.

Profit Sharing Plan

We believe Rand’s base salaries, bonuses and the Profit Sharing Plan collectively create an appropriate focus on long-term objectives and promote NEO retention. The terms of the SBA’s license for Rand SBIC require it to maintain a profit sharing plan that provides for payment to the NEOs of the designated percentages of the net realized capital gains (net of all unrealized capital losses and unrealized depreciation) of Rand SBIC. The Compensation Committee does not have discretion to change the amounts due under the Profit Sharing Plan.


88


Table of Contents

Under the Profit Sharing Plan, Rand pays its NEOs cumulative profit sharing payments equal to 12% of realized capital gains of Rand SBIC, net of realized capital losses and unrealized depreciation of Rand SBIC, for each fiscal year of Rand SBIC, computed in accordance with the Profit Sharing Plan.

The profit sharing payments are shared equally between Rand’s two NEOs, who are fully vested in the Profit Sharing Plan. Under the Investment Advisers Act of 1940 (Section 205(b)(3)) requirements, the aggregate amount which may be paid or accrued under the Profit Sharing Plan and any other incentive based plan maintained by Rand during any fiscal year, may not exceed 20% of Rand’s net income after taxes, as defined, for that fiscal year. In accordance with the 1940 Act requirements, a majority of the members of the Board who were not interested persons approved the Profit Sharing Plan on the basis that it is reasonable and fair to Rand’s shareholders, and does not involve overreaching of Rand or its shareholders on the part of any person concerned.

In 2018, no payments were due or payable to the NEOs under the Profit Sharing Plan.

Disbursement Triggers on Non-Equity Incentive Compensation

Realized gains from portfolio exits are typically received by Rand in a combination of lump sum payment (cash) and a release of escrow 12 to 24 months following closing. Profit sharing payments under the Profit Sharing Plan that are accrued by the Corporation are typically disbursed to the NEOs upon the receipt of cash proceeds. If a loss or deduction to funds held in escrow occurs due to post-closing adjustments or claims, the pro-rata profit sharing obligation payable to NEOs under the Profit Sharing Plan is forfeited. No money was accrued nor expected to be paid at December 31, 2018 pertaining to the Profit Sharing Plan.

Risk Considerations in our Compensation Program

The compensation of the NEOs consists of fixed and variable compensation. The fixed (or salary) portion of compensation is designed to provide a steady income so executives do not feel pressured to focus exclusively on short-term gains or annual stock price performance, which may be to the detriment of long-term appreciation and other business metrics. The variable (bonus and profit sharing) portions of compensation are designed to reward both short- and long-term corporate performance. For short-term performance, bonuses are qualitatively determined by the Compensation Committee and approved by the Board. For long-term performance, profit sharing is determined based on realized income from portfolio investment exits, net of realized and unrealized losses and depreciation. In addition, the following risk mitigation components exist:


Bonus payments are not tied directly to specific financial metrics, which reduces the risk that management is incented inappropriately to achieve desired targets and performance metrics;


Maintenance of the Profit Sharing Plan is required under the terms of the SBA’s license for Rand SBIC, and the SBA’s requirement to maintain the Profit Sharing Plan suggests that it believes that the Profit Sharing Plan provides for compensation to participants in an appropriate manner and in appropriate amounts;


89


Table of Contents
   

Profit sharing payments under the Profit Sharing Plan are limited by the Investment Advisers Act of 1940 to 20% of Rand’s net income after taxes as defined in any fiscal year;


The Board, Compensation Committee and independent registered public accountants review all profit sharing calculations prior to disbursement;


Each NEO’s personal investment portfolio includes a significant amount of Rand’s shares, which aligns their respective interests with the interests of our shareholders in Rand’s long-term success and stock price appreciation. At the end of 2018, Allen F. Grum owned 173,642 shares and Daniel P. Penberthy owned 84,467 shares.


The Profit Sharing Plan and our approach to payment of bonuses each have been in place for a number of years, and we have seen no evidence that they encourage unnecessary or excessive risk taking;


Rand has specific quarterly reporting, review and approval processes with its Board, which we believe are adequate to prevent manipulation by any employee, including our NEOs; and


The compensation and bonus of non-executive officers are qualitatively determined by the President and Chief Executive Officer, which we believe encourages a balanced approach to overall corporate performance.

Conclusion

Through the compensation and incentive structure described above, a significant portion of the amounts that may be payable as compensation have been, and will continue to be, contingent on Rand’s performance, and realization of incentive benefits is closely linked to increases in long-term shareholder value. Rand remains committed to this philosophy of pay for performance, recognizing the volatility of Rand’s investments may result in highly variable compensation from year to year.

In January 2019, the independent Directors of the Board approved a 6.1% increase in base salary for Mr. Grum, and a 10.9% increase in base salary for Mr. Penberthy.

Compensation Committee Report

The Compensation Committee has reviewed and discussed the Compensation Discussion and Analysis required by Item 402(b) of Regulation S-K with management and, based on its review and discussions with management, the Compensation Committee recommended to the Board of Directors that the Compensation Discussion and Analysis be included in this Annual Report on Form 10-K.


90


Table of Contents

Submitted by the Compensation Committee

Robert M. Zak, Chair

Erland E. Kailbourne

Jayne K. Rand          

The information provided in the preceding Compensation Committee Report will not be deemed to be “soliciting material” or “filed” with the SEC or subject to Regulation 14A or 14C, or to the liabilities of Section 18 of the Exchange Act, unless in the future the Corporation specifically requests that the information be treated as soliciting material or specifically incorporates it by reference into any filing under the Securities Act of 1933, as amended or the Exchange Act.

Summary Compensation Table

The following table sets forth information with respect to the compensation paid or earned for the 2018, 2017 and 2016 fiscal years to each NEO. Rand is not part of a fund complex.


Name and

Principal Position (1)

   Year    Salary (2)      Bonus (2)(3)      Non-Equity
Incentive Plan
Compensation(3)(7)
(Profit Sharing
Plan)
     All Other
Compensation (4)(5)
    Total
Compensation (6)
 

Allen F. Grum,

President and Chief Executive Officer

   2018    $ 245,000      $ 50,000      $ 0      $

$

16,500

16,666

(4) 

(5) 

  $ 328,166  
   2017    $ 240,000      $ 0      $ 0      $

$

16,020

16,666

(4) 

(5) 

  $ 272,686  
   2016    $ 223,871      $ 0      $ 635,026      $

$

15,989

16,060

(4) 

(5) 

  $ 890,946  

Daniel P. Penberthy,

Executive Vice President and Chief Financial Officer

   2018    $ 230,000      $ 50,000      $ 0      $

$

16,500

10,797

(4) 

(5) 

  $ 307,297  
   2017    $ 225,000      $ 0      $ 0      $

$

16,020

10,797

(4) 

(5) 

  $ 251,817  
   2016    $ 207,880      $ 0      $ 635,026      $

$

15,473

12,024

(4) 

(5) 

  $ 870,403  


(1)

Mr. Grum is Rand’s principal executive officer, and Mr. Penberthy is Rand’s principal financial officer.

(2)

Represent amounts earned, prior to employee 401(k) contributions.

(3)

Bonuses and non-equity incentive plan compensation were fully accrued as of December 31 of the respective year. Bonus amounts were disbursed subsequent to the respective year-end and, non-equity incentive compensation is expected to be paid in installments following receipt of respective realized gain proceeds, to include the completion of the escrow holdback period, which typically occurs in a 12 – 24 month period following exit from an investment.

(4)

Includes contributions made by Rand to the 401(k) plan account for the NEOs. Rand’s 401(k) plan is available to all Rand employees. Under the 401(k) plan, participants may elect to contribute up to 20% of their compensation on a pretax basis by salary reduction up to a maximum of $18,500 ($24,500 if age 50 or over) for 2018. For eligible employees, Rand makes a contribution of 1% of compensation and matches employee contributions up to 5%, subject to IRS annual compensation and contribution limits. In addition, Rand may elect to contribute an annual discretionary amount as determined by the Board of Directors. In 2018, 2017 and 2016, Rand did not make a discretionary contribution to the 401(k) plan.


91


Table of Contents
(5)

Amount indicated includes the cost of life insurance, disability insurance and business automobile reimbursement benefits.

(6)

Non-equity incentive compensation from the Profit Sharing Plan was 0% of total compensation for the NEOs in 2018. Total salary and bonus for the NEOs approximated 90%, 89% and 25% of total compensation in 2018, 2017 and 2016, respectively.

(7)

Non-equity incentive plan compensation consists of payments under the Profit Sharing Plan (in each case 6% of net realized capital gains of Rand SBIC as defined in the Profit Sharing Plan).

Option Plan

Rand does not have any outstanding equity awards, options or stock vesting rights.

Pension Benefits

Rand does not provide any tax-qualified defined benefit plan or supplemental executive retirement plan, or similar plan that provides for specified retirement payments or benefits.

Director Compensation

Effective January 1, 2016, Board compensation was changed so that each Board member receives a $25,000 per annum stipend for Board and Committee service, and per meeting fees were eliminated. Committee Chairs receive an additional stipend of $2,500 (Audit), $1,000 (Compensation) or $1,000 (Governance and Nominating). The Board Chair receives an additional $10,000 retainer. No other forms of compensation are utilized; however, Rand reimburses out-of-town Directors for travel and out-of-pocket expenses incurred in connection with their service on our Board.

The following table sets forth information with respect to the compensation paid to or earned by each non-employee Director for 2018. Rand did not pay or accrue any other compensation to Directors for 2018.


Name

   Fees Earned or Paid in Cash  

Erland E. Kailbourne

   $ 31,000  

Ross B. Kenzie

   $ 27,500  

Reginald B. Newman, II (1)

   $ 16,250  

Jayne K. Rand

   $ 25,000  

Robert M. Zak

   $ 26,000  


(1)

Mr. Newman served as Chairman of the Board until his death on April 7, 2018

Pay Ratio

As required by Section 953(b) of the Dodd-Frank Wall Street Reform and Consumer Protection Act and applicable SEC rules, we are providing the following information about the relationship of the annual total compensation of our employees and the annual total compensation of our President/Chief Executive Officer. The following is a reasonable estimate, prepared under applicable SEC rules, of the ratio of the annual total compensation


92


Table of Contents

of our President/Chief Executive Officer to the median of the annual total compensation of our other employees. We determined our median employee based on base salary, as reflected in our payroll records, for each of our three employees (excluding the President/Chief Executive Officer) as of December 31, 2018. The annual total compensation of our median employee (other than the President/Chief Executive Officer) for 2018 was $175,820. As disclosed in the Summary Compensation Table, our President/Chief Executive Officer’s annual total compensation for 2018 was $328,166. Based on the foregoing, our estimate of the ratio of the annual total compensation of our President/Chief Executive Officer to the median of the annual total compensation of all other employees was 1.9 to 1. Given the different methodologies that various public companies will use to determine an estimate of their pay ratio, the estimated ratio reported above should not be used as a basis for comparison between companies.

Compensation Committee Interlocks and Insider Participation

During the last fiscal year, none of the members of the Compensation Committee was an officer or employee or former officer or employee of Rand or had any relationship with respect to Rand that would require disclosure under Regulation S-K, Item 404.


Item 12.

Security Ownership of Certain Beneficial Owners and Management and Related Stockholder Matters

Beneficial Ownership of Shares

Unless otherwise indicated, the following table sets forth beneficial ownership of our shares on March 1, 2019, by (a) persons known by us to be beneficial owners of more than 5% of the outstanding shares, (b) the Directors and the NEOs, and (c) all Directors and executive officers as a group. For purposes of the table, the address for each of our Directors and NEOs is c/o 2200 Rand Building, Buffalo, NY 14203. Unless otherwise stated, each person named in the table has sole voting and investment power with respect to the shares indicated as beneficially owned by that person.


Beneficial Owner

   Amount and Nature of
Beneficial Ownership (1)
     Percent of Class
(3)
 

(a) More than 5% Owners:


User-Friendly Phone Book, LLC

10200 Grogan’s Mill Road

Suite 44440

The Woodlands, TX77380

     1,455,993        23.0

(b) Directors and named executive officers:


Allen F. Grum

     173,642        2.7

Erland E. Kailbourne

     40,000       

Ross B. Kenzie

     113,000        1.8

Jayne K. Rand

     115,433        1.8

Robert M. Zak

     85,000        1.3

Daniel P. Penberthy

     84,467        1.3

*  Less than 1%.


(c) All Directors and executive officers as a group (six persons)(2)

     611,542        9.7


(1)

The beneficial ownership information presented is based upon information furnished by each person or contained in filings made with the SEC.


93


Table of Contents
(2)

Members of the group have sole voting and investment power over these shares.

(3)

Percent of Class calculated based on 6,321,988 shares outstanding on March 1, 2019.

For a discussion of the Transactions, including previously announced sale of 8,333,333.33 shares of Rand’s common stock to East in the Stock Purchase, please see “Part I, Item 1 – Recent Developments.”


Item 13.

Certain Relationships and Related Transactions and Director Independence

Director Independence

The Board has affirmatively determined that all of the non-employee Directors, Erland E. Kailbourne, Ross B. Kenzie, Jayne K. Rand and Robert M. Zak are “Independent Directors” under the rules of the SEC and under the rules and guidelines of the Nasdaq Stock Market. Therefore, a majority of Rand’s five-person Board is currently independent as so defined. The Board has determined that there are no relationships between Rand and any of the Directors determined to be independent, other than service on its Board and compensation paid to those Directors. In addition, Reginald B. Newman II, who served as the Chairman of the Board during 2018, until his death on April 7, 2018 was also determined to be an Independent Director during such term of service as a Director.

Allen F. Grum has been determined to be an “interested person” under Section 2(a)(19) of the 1940 Act with respect to Rand because he is an executive officer of Rand. Directors who are determined to be interested persons do not qualify as Independent Directors under the rules and guidelines of the Nasdaq Stock Market.

The Board, with reference to the SEC rules and the Nasdaq Stock Market rules and guidelines, also determined that:


each member of the Audit Committee, the Governance and Nominating Committee, and the Compensation Committee is independent under the applicable Nasdaq Stock Market rules and guidelines and SEC rules for purposes of determining independence of members of each of those committees;


the compensation paid to the executive officers of Rand during 2018 was determined by a majority of the Independent Directors of the Board;


each member of the Audit Committee also meets the additional independence requirements under Rule 10A-3(b) of the Exchange Act and Nasdaq Rule 5605(c)(2)(a); and


each member of the Compensation Committee also meets the independence requirements under the rules and guidelines of Nasdaq Rule 5605(d)(2).


94


Table of Contents

Rand’s Chairman, Mr. Kailbourne, serves as chair of meetings of the Independent Directors. It is currently contemplated that “executive sessions” of the Independent Directors will occur at least twice during the year ending December 31, 2019. The Corporation will also hold separate committee meetings of the Board of Directors during 2019, which committees are comprised of Independent Directors.

Related Person Transactions

For the year ended December 31, 2018, there were no transactions, or proposed transactions, exceeding $120,000 in which the Corporation was or is a participant in which any related person had or will have a direct or indirect material interest.

In order to ensure that the Corporation does not engage in any related-party transactions with any persons affiliated with the Corporation, the Corporation requires that the Audit Committee must review in advance any “related-party” transaction, or series of similar transactions, to which the Corporation or any of its subsidiaries was or is to be a party, in which the amount involved exceeds $120,000 and in which such related party had, or will have, a direct or indirect material interest.


Item 14.

Principal Accountant Fees and Services

Independent Registered Public Accountant (“Independent Accountant”) Fees

The aggregate fees for each of the last two fiscal years for services rendered by Freed Maxick CPAs, P.C. (“Freed”) are as follows:


Fee Description

   2018      2017  

Audit

   $ 111,975      $ 108,475  

Audit Related

   $ 0      $ 0  

Tax

   $ 37,827      $ 31,000  

All Other

   $ 0      $ 0  

For fiscal years 2018 and 2017, all of the services of Freed described in the above categories were pre-approved by the Audit Committee.

Audit Fees

This category consists of fees for the audit of annual consolidated financial statements, review of consolidated financial statements included in quarterly reports on Form 10-Q and services that are normally provided by the independent accountant in connection with statutory and regulatory filings or audit engagements for those fiscal years.

Audit Related Fees

This category consists of assurance and related services by the independent accountant that are reasonably related to the performance of the audit and review of consolidated financial statements and are not reported under audit fees.


95


Table of Contents

Tax Fees

This category consists of professional services rendered by the independent accountant for tax compliance and tax planning. The services for the fees disclosed under this category include tax return preparation and technical advice provided by Freed.

All Other Fees

This category consists of fees not covered by Audit Fees, Audit Related Fees and Tax Fees.

Estimates of annual audit, quarterly review and tax fees to be paid during the year are submitted annually to the Audit Committee for its review and pre-approval and then budgeted for by Rand. All other non-audit services must be pre-approved by the Audit Committee prior to engagement, as required by the Audit Committee’s charter.


96


Table of Contents

Part IV


Item 15.

Exhibits and Financial Statement Schedules


  (a)

The following documents are filed as part of this report and included in Item 8:


   (1)    CONSOLIDATED FINANCIAL STATEMENTS
      Consolidated Statements of Financial Position as of December 31, 2018 and 2017
      Consolidated Statements of Operations for the three years in the period ended December 31, 2018
      Consolidated Statements of Changes in Net Assets for the three years in the period ended December 31, 2018
      Consolidated Statements of Cash Flows for the three years in the period ended December 31, 2018
      Consolidated Schedule of Portfolio Investments as of December 31, 2018
      Consolidated Schedule of Portfolio Investments as of December 31, 2017
      Financial Highlights Schedule for the five years in the period ended December 31, 2018
      Notes to the Consolidated Financial Statements
      Supplemental Schedule of Consolidated Changes in Investments at Cost and Realized Gain for the year ended December 31, 2018
      Report of Independent Registered Public Accounting Firm
   (2)    FINANCIAL STATEMENT SCHEDULES
      The required financial statement Schedule II – Valuation and Qualifying Accounts has been omitted because the information required is included in the Note 11 to the consolidated financial statements.


97


Table of Contents
  (b)

The following exhibits are filed with this report or are incorporated herein by reference to a prior filing, in accordance with Rule 12b-32 under the Securities Exchange Act of 1934, as amended.


   (3.1)(i)    Certificate of Incorporation of the Corporation, incorporated by reference to Exhibit (a)(1) of Form N-2 filed with the SEC on April 22, 1997. (File No. 333-25617).
   (3.1)(ii)    By-laws of the Corporation, incorporated by reference to Exhibit 3(ii) to the Corporation’s Quarterly Report on Form 10-Q for the period ended September 30, 2016 filed with the SEC on November 2, 2016. (File No. 814-00235).
   (3.2)(i)    Certificate of Incorporation of Rand Merger Corporation as filed by the NY Department of State on 12/18/08 – incorporated by reference to Exhibit 1(a) to Registration Statement No. 811-22276 on Form N-5 of Rand Capital SBIC, Inc. filed with the SEC on February 6, 2009. (File No. 811-22276).
   (3.2)(ii)    By-laws of Rand Capital SBIC, Inc. – incorporated by reference to Exhibit 2 to Registration Statement No. 811-22276 on Form N-5 of Rand Capital SBIC, Inc. filed with the SEC on February 6, 2009. (File No. 811-22276).
   (4)    Specimen certificate of common stock certificate, incorporated by reference to Exhibit (b)  of Form N-2 filed with the SEC on April 22, 1997. (File No. 333-25617).
   (10.2)    Certificate of Merger of Rand Capital SBIC, L.P. and Rand Capital Management, LLC into Rand Merger Corporation, as filed by the NY Department of State on 12/18/08 – incorporated by reference to Exhibit 1(b) to Registration Statement No. 811-22276 on Form N-5 of Rand Capital SBIC, Inc. filed with the SEC on February 6, 2009. (File No. 811-22276).
   (10.3)    Rand Capital Corporation Amended and Restated Profit Sharing Plan applicable to Rand Capital SBIC, Inc. – incorporated by reference to Exhibit 7 to Registration Statement No. 811-22276 on Form N-5 of Rand Capital SBIC, Inc. filed with the SEC on February 6, 2009. (File No. 811-22276).*
   (10.4)    Change in Control Agreement, dated as of March  1, 2017, by and between the Corporation and Allen F. Grum, incorporated by reference to Exhibit 10.1 to the Corporation’s Current Report on Form 8-K filed with the SEC on March 3, 2017. (File No. 814-00235).*
   (10.5)    Change in Control Agreement, dated as of March  1, 2017, by and between the Corporation and Daniel P. Penberthy, incorporated by reference to Exhibit 10.2 to the Corporation’s Current Report on Form 8-K filed with the SEC on March 3, 2017. (File No. 814-00235).*


98


Table of Contents
   (10.6)    Stock Purchase Agreement dated as of January  24, 2019 by and among East Asset Management LLC, Rand Capital Corporation and, solely for purposes of being bound by Sections 7.10 and 10.9(a) and (b)  thereof, Rand Capital Management LLC, incorporated by reference to exhibit 10.1 to the Corporation’s Current Report on Form 8-K filed with the SEC on January 25, 2019.
   (31.1)    Certification of Principal Executive Officer Pursuant to Rules 13a-14(a)/15d-14(a) under the Securities Exchange Act of 1934, as amended – filed herewith.
   (31.2)    Certification of Principal Financial Officer Pursuant to Rules 13a-14(a)/15d-14(a) under the Securities Exchange Act of 1934, as amended – filed herewith.
   (32.1)    Certification Pursuant to Section 906 of the Sarbanes-Oxley Act of 2002 – Rand Capital Corporation – filed herewith.


*

Management contract or compensatory plan.


Item 16.

Form 10-K Summary

None


99


Table of Contents

Signatures

Pursuant to the requirements of Section 13 or 15(d) of Securities Exchange Act of 1934, the registrant has duly caused this Report on Form 10-K to be signed on its behalf by the undersigned thereunto duly authorized.


Date: March 7, 2019


RAND CAPITAL CORPORATION

    By:  /s/ Allen F. Grum                                                                     
    Allen F. Grum, President

Pursuant to the requirements of the Securities Exchange Act of 1934, this Annual Report on Form 10-K has been signed below by the following persons on behalf of the Corporation in the capacities and on the dates indicated.


Signature/Title      
(i) Principal Executive Officer:      

/s/ Allen F. Grum

     
Allen F. Grum / President    March 7, 2019   
(ii) Principal Accounting & Financial Officer:      

/s/ Daniel P. Penberthy

     
Daniel P. Penberthy / Treasurer    March 7, 2019   
(iii) Directors:      

/s/ Allen F. Grum

     
Allen F. Grum / Director    March 7, 2019   

/s/ Erland E. Kailbourne

     
Erland E. Kailbourne / Director    March 7, 2019   

/s/ Ross B. Kenzie

     
Ross B. Kenzie / Director    March 7, 2019   

/s/ Jayne K. Rand

     
Jayne K. Rand / Director    March 7, 2019   

/s/ Robert M. Zak

     
Robert M. Zak / Director    March 7, 2019   


100