UNITED STATES SECURITIES AND EXCHANGE COMMISSION
Washington, D.C. 20549
FORM 10-K
| þ | ANNUAL REPORT PURSUANT TO SECTION 13 OR 15(d) OF THE SECURITIES EXCHANGE ACT OF 1934 |
For the fiscal year ended December 31, 2014
| ¨ | TRANSITION REPORT PURSUANT TO SECTION 13 OR 15(d) OF THE SECURITIES EXCHANGE ACT OF 1934 |
For the Transition Period from to
Commission File Number: 814-00235
Rand Capital Corporation
(Exact name of registrant as specified in its charter)
| New York | 16-0961359 | |
| (State or Other Jurisdiction of Incorporation or organization) |
(IRS Employer Identification No.) | |
| 2200 Rand Building, Buffalo, NY | 14203 | |
| (Address of Principal executive offices) | (Zip Code) | |
Registrant’s telephone number, including area code: (716) 853-0802
Securities registered pursuant to Section 12(b) of the Act:
| Title of Each Class |
Name of Exchange on Which Registered | |
| Common Stock, $0.10 par value | NASDAQ Capital Market |
Securities registered pursuant to Section 12(g) of the Act: None
Indicate by check mark if the registrant is a well-known seasoned issuer, as defined in Rule 405 under the Securities Act. Yes ¨ No þ
Indicate by check mark if the registrant is not required to file reports pursuant to Section 13 or Section 15(d) of the Act. Yes ¨ No þ
Indicate by check mark whether the registrant (1) has filed all reports required to be filed by Section 13 or 15(d) of the Securities Exchange Act of 1934 during the preceding 12 months (or for such shorter period that the registrant was required to file such reports), and (2) has been subject to such filing requirements for the past 90 days. Yes þ No ¨
Indicate by check mark whether the registrant has submitted electronically and posted on its corporate Web site, if any, every Interactive Data File required to be submitted and posted pursuant to Rule 405 of Regulation S-T during the preceding 12 months (or for such shorter period that the registrant was required to submit and post such files). Yes ¨ No ¨
Indicate by check mark if disclosure of delinquent filers pursuant to Item 405 of Regulation S-K is not contained herein, and will not be contained, to the best of registrant’s knowledge, in definitive proxy or information statements incorporated by reference in Part III of this Form 10-K or any amendment to this Form 10-K. þ
Indicate by check mark whether the registrant is a large accelerated filer, an accelerated filer, a non-accelerated filer or a smaller reporting company.
| Large accelerated filer ¨ | Accelerated filer ¨ | Non-accelerated filer þ | Smaller reporting company ¨ | |||
| (Do not check if a smaller reporting company) | ||||||
Indicate by check mark whether the registrant is a shell company (as defined in Rule 12b-2 of the Act). Yes ¨ No þ
The aggregate market value of the registrant’s outstanding common stock held by non-affiliates of the registrant as of June 30, 2014 was approximately $17,938,400 based upon the closing price as quoted by NASDAQ Capital Market on such date.
As of March 6, 2015, there were 6,328,538 shares of the registrant’s common stock outstanding.
DOCUMENTS INCORPORATED BY REFERENCE
Portions of the Corporation’s definitive proxy statement for the 2015 Annual Meeting of Shareholders are incorporated by reference into Part III of this report.
RAND CAPITAL CORPORATION
TABLE OF CONTENTS FOR FORM 10-K
| Business | 1 | |||||
| Risk Factors | 5 | |||||
| Unresolved Staff Comments | 7 | |||||
| Properties | 7 | |||||
| Legal Proceedings | 7 | |||||
| Mine Safety Disclosures | 7 | |||||
| Market for Registrant’s Common Equity, Related Stockholder Matters and Issuer Purchases of Equity Securities | 8 | |||||
| Selected Financial Data | 10 | |||||
| Management’s Discussion and Analysis of Financial Condition and Results of Operations | 10 | |||||
| Quantitative and Qualitative Disclosures about Market Risk | 26 | |||||
| Financial Statements and Supplementary Data | 27 | |||||
| Changes in and Disagreements with Accountants on Accounting and Financial Disclosure | 64 | |||||
| Controls and Procedures | 64 | |||||
| Other Information | 64 | |||||
| Directors, Executive Officers and Corporate Governance | 64 | |||||
| Executive Compensation | 65 | |||||
| Security Ownership of Certain Beneficial Owners and Management and Related Stockholder Matters | 65 | |||||
| Certain Relationships and Related Transactions, and Director Independence | 65 | |||||
| Principal Accountant Fees and Services | 65 | |||||
| Exhibits and Financial Statement Schedules | 65 | |||||
Organization and History
Rand Capital Corporation (“Rand”, “we”, “us” and “our”) was incorporated under the laws of New York in February 1969. We completed our initial public offering in 1971 as an internally managed, closed-end, diversified, management investment company. We have elected to be treated as a business development company (“BDC”) under the Investment Company Act of 1940, as amended (the “1940 Act”). As a BDC we are required to comply with certain regulatory requirements. For instance, we generally have to invest at least 70% of our total assets in “qualifying assets” and provide managerial assistance to the portfolio companies in which we invest. See Item 1. Business — Regulation, Regulation as a Business Development Company.
We make the majority of our investments through our wholly-owned subsidiary, Rand Capital SBIC, Inc. (“Rand SBIC”) which operates as a small business investment company (“SBIC”) and has been licensed by the U.S. Small Business Administration (“SBA”) since 2002. Rand SBIC’s predecessor was organized as a Delaware limited partnership and was converted into a New York corporation on December 31, 2008, at which time our operations as a licensed SBIC were continued. Although Rand SBIC was operated as if it were a BDC, it was registered as an investment company under the 1940 Act. On February 28, 2012, the SEC granted an Order of Exemption for Rand with respect to the operations of Rand SBIC and in March 2012, Rand SBIC filed an election to be regulated as a BDC under the 1940 Act. Rand SBIC’s board of directors is comprised of the directors of Rand, a majority of whom are not “interested persons” of Rand or Rand SBIC.
We operate as an internally managed investment company whereby our officers and employees conduct their business under the general supervision of the Board of Directors. We have not elected to qualify to be taxed as a regulated investment company as defined under Subchapter M of the Internal Revenue Code.
In this Annual Report on Form 10-K, or Annual Report, unless the context otherwise requires, “we”, the “Corporation”, “us”, and “our” refer to Rand Corporation and Rand Capital SBIC, Inc.
Our corporate office is located in Buffalo, NY and our website address is www.randcapital.com. We make available free of charge on our website our annual and periodic reports, proxy statements and other information as soon as reasonably practicable after such material is filed with the Securities and Exchange Commission (“SEC”). Our shares are traded on the NASDAQ Capital Market under the ticker symbol “RAND”.
Overview of Our Business
Throughout our history, our principal business has been to make venture capital investments in early or expansion stage companies, typically in New York and its surrounding states. We look for companies with strong leadership that are bringing to market new or unique products, technologies or services and have a high potential for growth. We invest in a mixture of debt and equity instruments. The debt securities typically have an equity component in the form of warrants or options to acquire stock or the right to convert the debt securities into stock. Rand SBIC has been our primary investment vehicle since its formation and we expect to continue this practice.
Our Investment Objectives and Strategy
Our principal investment objective is to achieve long-term capital appreciation on our equity investments while maintaining a current cash flow from our debenture and pass-through equity instruments. Therefore, we invest in a variety of financial instruments to provide a current return on a portion of the investment portfolio. The equity features contained in our investment portfolio are structured to realize capital appreciation over the long-term and typically do not generate current income in the form of dividends or interest.
Typically, our investment strategy is to partner with other investors and invest in small companies that either have a new product, service or technology they are trying to commercialize or are working to accelerate their rate of growth. We define small companies as businesses that may not yet be generating revenue up to companies that may have $20 million in revenue.
1
We usually make initial investments of $500,000 to $1,000,000 directly in a company through equity or in debt or loan instruments. The debt instruments generally have a maturity of not more than five years and usually have detachable equity warrants. Interest is either paid currently or deferred. We fund new investments and operating expenses through existing cash balances, proceeds from SBA debentures, investment returns, and interest and principal payments from our portfolio companies.
Our Investment Process
Our primary business is making subordinated debt and equity investments in small and medium-sized companies that meet certain criteria which may include some or all of the following characteristics:
1) a qualified and experienced management team;
2) a new or unique product or service;
3) high potential for growth in revenue and cash flow; and
4) potential to realize appreciation in an equity position, if any.
Our management team identifies investment opportunities through a network of investment referral relationships. Investment proposals may come to us from other sources, including unsolicited proposals from companies and referrals from banks, lawyers, accountants and other members of the financial community. We believe that our reputation in the investment community and our experience provide a competitive advantage in originating qualified new investments.
In a typical private financing, our management team will review, analyze, and confirm, through due diligence, the business plan and operations of the potential portfolio company. Additionally, we will familiarize ourselves with the portfolio company’s industry and competition and may conduct reference checks with its customers and suppliers.
Following our initial investment, we may make follow-on investments in the portfolio company. Follow-on investments may be made to take advantage of warrants or other preferential rights granted to us to increase or maintain our position in a promising portfolio company, or provide an additional investment to allow a portfolio company to fully implement its business plans, develop a new line of business or recover from unexpected business problems. Follow-on investments in a portfolio company are evaluated individually and may be subject to regulatory restrictions.
Disposition of Investments
We may exit investments through the maturation of a debt security or when a liquidity event takes place, such as the sale, recapitalization, or initial public offering of a portfolio company. The method and timing of the disposition of our portfolio investments can be critical to the realization of maximum total return. We generally expect to dispose of our equity securities through private sales of securities to other investors or through an outright sale of the company or a merger. We anticipate our debt investments will be repaid with interest and hope to realize further appreciation from the warrants or other equity type instruments we receive in connection with the investment.
Current Portfolio Companies
For a description of our current portfolio company investments, see “Item 7. Management’s Discussion and Analysis of Financial Conditions and Results of Operations — Composition of the Corporation’s Investment Portfolio.”
Competition
We compete for investments with other business development companies or investment funds (including private equity funds and mezzanine funds), as well as traditional financial services companies such as commercial banks. We believe we are able to compete with these entities primarily on the basis of our
2
management’s experience and network, our responsive, quick and efficient investment analysis and decision-making process, the investment terms we offer, and our willingness to make smaller investments.
For information concerning the competitive risks we face, see “Item 1A. Risk Factors.”
Employees
As of December 31, 2014, we had four employees, unchanged from 2013.
Regulation
The following discussion is a general summary of the material prohibitions and descriptions governing BDCs and SBA- licensed SBICs. It does not purport to be a complete description of all of the laws and regulations affecting BDCs and SBICs.
Regulation as a Business Development Company
We have elected to be regulated as a BDC under the 1940 Act. Although the 1940 Act exempts a BDC from registration under that Act, it contains significant limitations on the operations of BDCs. Among other things, the 1940 Act contains prohibitions and restrictions relating to transactions between a BDC and its affiliates, principal underwriters and affiliates of its affiliates or underwriters. The 1940 Act also prohibits a BDC from changing the nature of its business so as to cease to be, or to withdraw its election as, a BDC unless so authorized by a vote of the holders of a majority of its outstanding voting securities. BDCs are not required to maintain fundamental investment policies relating to diversification and concentration of investments within a single industry. More specifically, in order to qualify as a BDC, a company must:
(1) be a domestic company;
(2) have registered a class of its equity securities or have filed a registration statement with the SEC pursuant to Section 12 of the Securities Exchange Act of 1934 (the “Exchange Act”);
(3) operate for the purpose of investing in the securities of certain types of companies, namely immature or emerging companies and businesses suffering or just recovering from financial distress. Generally, a BDC must be primarily engaged in the business of furnishing capital and providing managerial expertise to companies that do not have ready access to capital through conventional financial channels. Such companies are termed “eligible portfolio companies;”
(4) extend significant managerial assistance to such portfolio companies; and
(5) have a majority of “disinterested” directors (as defined in the 1940 Act).
Qualifying Assets
Under the 1940 Act, a BDC may not acquire any asset other than assets of the type listed in Section 55(a) of the 1940 Act, which are referred to as qualifying assets, unless, at the time the acquisition is made, qualifying assets represent at least 70% of the company’s total assets. The 1940 Act prohibits business development companies from investing in certain types of companies, such as brokerage firms, insurance companies, investment banking firms and investment companies.
An eligible portfolio company is, generally, a private domestic operating company, or a public domestic operating company whose securities are not listed on a national securities exchange. In addition, any small business investment company that is licensed by the SBA and is a wholly owned subsidiary of a BDC is an eligible portfolio company.
Qualifying assets include:
(1) securities of companies that were eligible portfolio companies at the time the BDC acquired their securities;
(2) securities of bankrupt or insolvent companies that were eligible at the time of the BDC’s initial acquisition of their securities but are no longer eligible, provided that the BDC has maintained a substantial portion of its initial investment in those companies;
3
(3) securities received in exchange for or distributed on or with respect to any of the foregoing; and
(4) cash items, government securities and high-quality short-term debt.
The 1940 Act also places restrictions on the nature of the transactions in which, and the persons from whom, securities can be purchased in order for the securities to be considered qualifying assets.
A BDC is permitted to invest in the securities of public companies and other investments that are not qualifying assets, but those kinds of investments may not exceed 30% of the BDC’s total asset value at the time of the investment. At December 31, 2014, we were in compliance with this rule.
Managerial Assistance to Portfolio Companies
In order to count portfolio securities as qualifying assets for the purpose of the 70% test discussed above, a BDC must either control the issuer of the securities or must offer to make available significant managerial assistance; except that, where the BDC purchases the securities in conjunction with one or more other persons acting together, one of the other persons in the group may make available such managerial assistance. Making available significant managerial assistance means, among other things, any arrangement whereby the BDC, through its directors, officers or employees, offers to provide and, if accepted, does so provide, significant guidance and counsel concerning the management, operations or business objectives and policies of a portfolio company through monitoring of portfolio company operations, selective participation in board and management meetings, consulting with and advising a portfolio company’s officers or other organizational or financial guidance.
Small Business Investment Company Regulations
SBA Lending Restrictions
SBICs are designed to stimulate the flow of private debt and/or equity capital to small businesses. The types and dollar amounts of the loans and other investments we may make are limited by the 1940 Act, the Small Business Act (the “SBA Act”) and SBA regulations. Rand SBIC uses funds borrowed from the SBA, that can be combined with our own capital, to provide loans to, and make equity investments in, businesses that meet the following criteria:
(a) have a tangible net worth not in excess of $18 million and average net income after U.S. federal income taxes for the preceding two completed fiscal years not in excess of $6 million, or
(b) meet size standards set by the SBA that are measured by either annual receipts or number of employees, depending on the industry in which the businesses are primarily engaged.
In addition, at the end of each fiscal year, an SBIC must have at least 20% (in total dollars) invested in “smaller enterprises.” The SBA defines “smaller enterprises” as businesses that:
(a) do not have a net worth in excess of $6 million and have average net income after U.S. federal income taxes for the preceding two years no greater than $2 million, or
(b) meet size standards set by the SBA that are measured by either annual receipts or number of employees, depending on the industry in which the concerns are primarily engaged.
We have complied with this requirement since the inception of SBIC.
Rand SBIC subsidiary is subject to regulation and oversight by the SBA. Receipt of an SBIC license does not assure that Rand SBIC will receive SBA guaranteed debenture funding, which is dependent upon it continuing to be in compliance with SBA regulations and policies. The SBA, as a creditor, will have a superior claim to Rand SBIC’s assets over our stockholders in the event we liquidate Rand SBIC or the SBA exercises its remedies under the SBA-guaranteed debentures issued by Rand SBIC upon an event of default.
Rand SBIC may invest directly in the equity of portfolio companies, but may not become a general partner of a non-incorporated entity or otherwise become jointly or severally liable for the general obligations of a non-incorporated entity. Rand SBIC may acquire options or warrants in portfolio companies, and the options or warrants may have redemption provisions, subject to certain restrictions.
4
SBA Leverage
The SBA raises capital to enable it to provide funds to SBICs by guaranteeing certificates or bonds that are pooled and sold to purchasers of the government guaranteed securities. The amount of funds that the SBA may lend to SBICs is determined by annual Congressional appropriations.
SBA debentures are issued with ten year maturities. Interest only is payable semi-annually until maturity. All of our outstanding SBA debentures may be prepaid without penalty. To reserve the approved SBA debenture leverage we paid an upfront 1% commitment fee to the SBA as a partial prepayment of the SBA’s nonrefundable 3% leverage fee. These fees are expensed over the life of the corresponding SBA debenture instruments.
At December 31, 2014, we had $8,000,000 in outstanding leverage.
Economic downturns or recessions may adversely affect our portfolio companies’ financial performance and therefore harm our operating results
The capital markets have periodically experienced periods of instability and recessions and it is likely that the financial results of the small to medium-sized companies that we invest in could be negatively affected by this instability and suffer deterioration in their financial results. This deterioration may have a negative effect on our financial performance.
Investing in our shares may be inappropriate for investor’s risk tolerance
Our investments, in accordance with our investment objective and principal strategies, result in a greater than average amount of risk and volatility and may result in loss of principal. Our investments in portfolio companies are highly speculative and aggressive and, therefore, an investment in our shares may not be suitable for investors for whom such risk is inappropriate. Neither our investments nor an investment in our shares constitutes a balanced investment program.
We are subject to risks created by the valuation of our portfolio investments
At December 31, 2014, 98% of our investments are in private securities that are not publicly traded. There is typically no public market for securities of the small privately held companies in which we invest. Investments are valued in accordance with our established valuation policy and are stated at fair value as determined in good faith by management and approved by our Board of Directors. In the absence of a readily ascertainable market value, the estimated value of our portfolio of securities may differ significantly, favorably or unfavorably, from the values that would be placed on the portfolio if a ready market for the securities existed. Any changes in estimated value are recorded in the consolidated statement of operations as “Net increase (decrease) in unrealized appreciation on investments.”
The lack of liquidity in our investments may adversely affect our business
We invest, and will continue to invest, in portfolio companies that are not publicly traded, and whose securities are subject to restrictions on resale and will be less liquid than publicly traded securities. Most of our investments are or will be either equity securities or subordinated debt securities acquired directly from small, private companies. The illiquidity of most of our portfolio may adversely affect our ability to dispose of the securities at times when it may be advantageous for us to liquidate investments. In addition, we may not realize the full value of these private investments if we have to liquidate all or a part of our portfolio quickly.
Investing in private companies involves a high degree of risk
We typically invest a substantial portion of our assets in small and medium sized private companies. These private businesses may be thinly capitalized, unproven companies with risky technologies, may lack management depth, and may not have attained profitability. Because of the speculative nature and the lack of a public market for these investments, there is significantly greater risk of loss than is the case with securities traded on a public
5
exchange. We expect that some of our venture capital investments will become worthless and that some will appear likely to become successful but will never realize their potential. We have been risk seeking rather than risk averse in our approach to venture capital and other investments.
Even if our portfolio companies are able to develop commercially viable products, the market for new products and services is highly competitive and rapidly changing. Commercial success is difficult to predict and the marketing efforts of the portfolio companies may not be successful.
We are subject to risks created by our regulated environment
We are regulated by the SBA and the SEC. Changes in the laws or regulations that govern SBICs and BDCs could significantly affect our business. Regulations and laws may be changed periodically, and the interpretations of the relevant regulations and laws are also subject to change. Any change in the regulations and laws governing our business could have a material impact on our financial condition and our results of operations. Moreover, the laws and regulations that govern BDCs and SBICs may place conflicting demands on the manner in which we operate, and the resolution of those conflicts may restrict or otherwise adversely affect our operations.
We are subject to risks created by borrowing funds from the SBA
Our liabilities may include large amounts of debt securities issued through the SBA which have fixed interest rates. Until and unless we are able to invest substantially all of the proceeds from debentures at annualized interest or other rates of return that substantially exceed annualized interest rates that Rand SBIC must pay the SBA, our operating results may be adversely affected which may, in turn, depress the market price of our common stock.
Competitive market for investment opportunities
We operate in a highly competitive market for investment opportunities. We face competition in our investing activities from many entities including other SBICs, private venture capital funds, investment affiliates of large companies, wealthy individuals and other domestic or foreign investors. The competition is not limited to entities that operate in the same geographical area as we do. As a regulated BDC, we are required to disclose quarterly and annually the name and business description of our portfolio companies and the value of their portfolio securities. Most of our competitors are not subject to this disclosure requirement. This obligation to disclose this information could hinder our ability to invest in some portfolio companies. Additionally, other regulations, current and future, may make us less attractive as a potential investor to a given portfolio company than a private venture capital fund.
We are dependent upon key management personnel for future success
We are dependent on the skill, diligence, and the network of business contacts of our two senior officers, Allen F. Grum and Daniel P. Penberthy, for the selection, structuring, closing, monitoring and valuation of our investments. Our future success depends, to a significant extent, on the continued employment of these two individuals and their departure could materially adversely affect our ability to implement our business strategy. We do not maintain key man life insurance on our officers or employees.
We have a limited number of companies in our portfolio of investments, and may be subjected to greater risk if any of these companies default
Our portfolio investment values are concentrated in a small number of companies and as such, we may experience a significant loss in our net asset value if one or more of these companies perform poorly or go out of business. The unrealized or realized write down of any one of these companies would negatively impact our net asset value.
Fluctuations of Quarterly Results
Our quarterly operating results could fluctuate significantly as a result of a number of factors. These factors include, among others, variations in and the timing of the recognition of realized and unrealized gains or losses, the degree to which portfolio companies encounter competition in their markets, and general economic
6
conditions. As a result of these factors, results for any quarter cannot be relied upon as being indicative of performance in future quarters or for a full year.
Item 1B. Unresolved Staff Comments
Not applicable.
We currently lease office space in Buffalo, New York for our corporate headquarters. We believe that the leased facilities are adequate to support our current staff and expected future needs.
None.
Item 4. Mine Safety Disclosures
Not applicable.
7
| Item 5. | Market for Registrant’s Common Equity, Related Stockholder Matters and Issuer Purchases of Equity Securities |
Our common stock (“Common Stock”) is traded on the NASDAQ Capital Market (“NASDAQ”) under the symbol “RAND.” The following table sets forth, for the periods indicated, the range of high and low closing sales prices per share as reported by NASDAQ:
| 2014 Quarter ended: |
High | Low | ||||||
| March 31 |
$ | 3.56 | $ | 3.00 | ||||
| June 30 |
$ | 3.51 | $ | 3.11 | ||||
| September 30 |
$ | 3.24 | $ | 2.99 | ||||
| December 31 |
$ | 4.12 | $ | 3.04 | ||||
| 2013 Quarter ended: |
High | Low | ||||||
| March 31 |
$ | 3.10 | $ | 2.30 | ||||
| June 30 |
$ | 3.15 | $ | 2.76 | ||||
| September 30 |
$ | 3.01 | $ | 2.90 | ||||
| December 31 |
$ | 3.19 | $ | 2.73 | ||||
We have not paid any cash dividends in the two most recent fiscal years, and have no present intention of paying cash dividends in the 2015 fiscal year.
Issuer Purchases of Equity Securities
| Period |
Total number of shares purchased(1) |
Average price paid per share(2) |
Total number of shares purchased as part of publicly announced plan(3) |
Maximum number of shares that may yet be purchased under the share repurchase plan(3) |
||||||||||||
| 10/1 – 10/31/2014 |
23,880 | $ | 3.09 | 23,880 | 496,507 | |||||||||||
| 11/1 – 11/30/2014 |
31,003 | $ | 3.08 | 31,003 | 465,504 | |||||||||||
| 12/1 – 12/31/14 |
— | — | — | 465,504 | ||||||||||||
| (1) | The total number of shares repurchased during 2014 was 83,380 shares. All transactions were made in the open market. |
| (2) | The average price paid per share is calculated on a settlement basis and includes commission. |
| (3) | On October 23, 2014, the Board of Directors authorized the repurchase of up to 1,000,000 shares of the Common Stock on the open market at prices no greater than the then current net asset value through October 23, 2015. |
Shareholders of Record
On March 6, 2015 we had a total of 865 shareholders, which included 94 record holders of our Common Stock, and an estimated 771 holders with shares beneficially owned in nominee name or under clearinghouse positions of brokerage firms or banks.
8
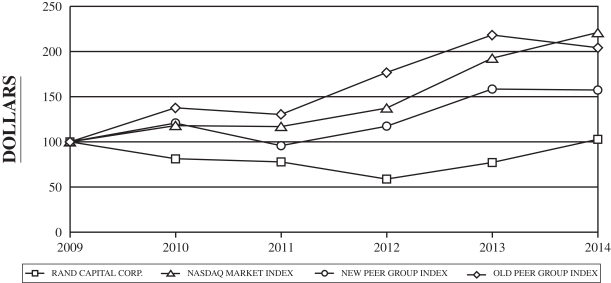
Corporation Performance Graph
The following graph shows a five-year comparison of cumulative total shareholder returns for our Common Stock, the NASDAQ Market Index, and an old and new Peer Group, assuming a base index of $100 at the end of 2009. The cumulative total return for each annual period within the five years presented is measured by dividing (1) the sum of (A) the cumulative amount of dividends for the measurement period, assuming dividend investment, and (B) the difference between share prices at the end and at the beginning of the measurement period by (2) the share price at the beginning of the measurement period.
Comparison of 5 Year Cumulative Total Return
Assumes Initial Investment of $100
December 2014
Comparison of cumulative total return of one or more companies, peer groups, industry indexes and/or broad markets
FISCAL YEAR ENDED
| Company/Index/Market | 2009 | 2010 | 2011 | 2012 | 2013 | 2014 | ||||||||||||||||||
| Rand Capital Corporation |
$ | 100.00 | $ | 81.16 | $ | 77.89 | $ | 58.80 | $ | 77.14 | $ | 102.77 | ||||||||||||
| NASDAQ Market Index |
$ | 100.00 | $ | 118.02 | $ | 117.04 | $ | 137.47 | $ | 192.62 | $ | 221.02 | ||||||||||||
| New Peer Group Index |
$ | 100.00 | $ | 120.86 | $ | 95.72 | $ | 117.40 | $ | 158.42 | $ | 157.40 | ||||||||||||
| Old Peer Group Index |
$ | 100.00 | $ | 137.51 | $ | 130.36 | $ | 176.68 | $ | 218.12 | $ | 204.14 | ||||||||||||
The New Peer Group was comprised of the following companies:
Capital Southwest Corporation (NasdaqGS: CSWC)
First Hand Technology Value Fund, Inc. (NasdaqGS:SVVC)
GSV Capital Corp. (NasdaqCM:GSVC)
Harris & Harris Group, Inc. (NasdaqGM:TINY)
The Old Peer Group was comprised of the following companies:
Equus Total Return (NYSE:EQS)
Gladstone Investment Corporation (NasdaqGS:GAIN)
Harris & Harris Group, Inc. (NasdaqGM:TINY)
Hercules Technology Growth Capital, Inc. (NasdaqGS: HTGC)
Main Street Capital Corporation (NasdaqGS: MAIN)
MCG Capital Corporation (NasdaqGS:MCGC)
Triangle Capital Corporation (NasdaqGM: TCAP)
9
We selected the New Peer Group because it is our belief that the four issuers in the new group have investment objectives that are similar to ours, and that among the publicly traded companies, they are relatively similar in size to us.
The performance graph information provided above will not be deemed to be “soliciting material” or “filed” with the SEC or subject to Regulations 14A or 14C, or to the liabilities of section 18 of the Securities Exchange Act, unless in the future we specifically request that the information be treated as soliciting material or specifically incorporate it by reference into any filing under the Securities Act or the Exchange Act.
Item 6. Selected Financial Data
The following table provides selected consolidated financial data for the periods indicated. You should read the selected financial data set forth below in conjunction with Item 7, “Management’s Discussion and Analysis of Financial Condition and Results of Operations,” and with the consolidated financial statements and related notes appearing within Item 8. of this Annual Report.
Balance Sheet Data as of December 31:
| 2014 | 2013 | 2012 | 2011 | 2010 | ||||||||||||||||
| Total assets |
$ | 45,525,987 | $ | 39,750,370 | $ | 34,252,413 | $ | 31,331,957 | $ | 35,091,260 | ||||||||||
| Total liabilities |
$ | 13,172,546 | $ | 11,681,038 | $ | 8,470,113 | $ | 6,932,836 | $ | 12,040,442 | ||||||||||
| Net assets |
$ | 32,353,441 | $ | 28,069,332 | $ | 25,782,300 | $ | 24,399,121 | $ | 23,050,818 | ||||||||||
| Net asset value per outstanding share |
$ | 5.11 | $ | 4.38 | $ | 3.90 | $ | 3.58 | $ | 3.38 | ||||||||||
| Shares of common stock outstanding |
6,328,538 | 6,411,918 | 6,610,236 | 6,818,934 | 6,818,934 | |||||||||||||||
Operating Data for the years ended December 31:
| 2014 | 2013 | 2012 | 2011 | 2010 | ||||||||||||||||
| Investment income |
$ | 2,584,475 | $ | 2,451,036 | $ | 2,604,621 | $ | 1,292,352 | $ | 847,283 | ||||||||||
| Total expenses |
$ | 2,499,297 | $ | 2,359,252 | $ | 1,795,600 | $ | 1,661,674 | $ | 2,367,911 | ||||||||||
| Net investment gain (loss), net of tax |
$ | 21,835 | $ | 154,478 | $ | 686,061 | $ | (81,738 | ) | $ | (973,189 | ) | ||||||||
| Net realized gain (loss) on sales and dispositions of investments, net of tax |
$ | 4,767,484 | $ | 4,374,354 | $ | 831,139 | $ | (1,515,885 | ) | $ | 3,222,688 | |||||||||
| Net (decrease) increase in unrealized appreciation on investments, net of tax |
$ | (247,838 | ) | $ | (1,655,475 | ) | $ | 422,567 | $ | 2,945,926 | $ | (2,404,562 | ) | |||||||
| Net increase (decrease) in net assets from operations |
$ | 4,541,481 | $ | 2,873,357 | $ | 1,939,767 | $ | 1,348,303 | $ | (155,063 | ) | |||||||||
Item 7. Management’s Discussion and Analysis of Financial Condition and Results of Operations
You should read the following discussion and analysis of our financial condition and results of operations in conjunction with the consolidated financial statements and related notes included within Item 8. of this Annual Report.
FORWARD LOOKING STATEMENTS
Statements included in this Management’s Discussion and Analysis of Financial Condition and Results of Operations and elsewhere in this report that do not relate to present or historical conditions are “forward-looking statements” within the meaning of that term in Section 27A of the Securities Act of 1933, and in Section 21F of
10
the Securities Exchange Act of 1934. Additional oral or written forward-looking statements may be made by us from time to time, and forward-looking statements may be included in documents that are filed with the Securities and Exchange Commission. Forward-looking statements involve risks and uncertainties that could cause results or outcomes to differ materially from those expressed in the forward-looking statements. Forward-looking statements may include, without limitation, statements relating to our plans, strategies, objectives, expectations and intentions and are intended to be made pursuant to the safe harbor provisions of the Private Securities Litigation Reform Act of 1995. Words such as “believes,” “forecasts,” “intends,” “possible,” “expects,” “estimates,” “anticipates,” or “plans” and similar expressions are intended to identify forward-looking statements. Among the important factors on which such statements are based are assumptions concerning the state of the United States economy and the local markets in which our portfolio companies operate, the state of the securities markets in which the securities of the our portfolio companies trade or could be traded, liquidity within the United States financial markets, and inflation. Forward-looking statements are also subject to the risks and uncertainties described under the caption “Risk Factors” contained in Part I, Item 1A. of this Annual Report.
There may be other factors not identified that affect the accuracy of our forward-looking statements. Further, any forward-looking statement speaks only as of the date it is made and, except as required by law, we undertake no obligation to update any forward-looking statement to reflect events or circumstances after the date on which it is made or to reflect the occurrence of anticipated or unanticipated events or circumstances. New factors emerge from time to time that may cause our business not to develop as we expect, and we cannot predict all of them.
Overview
We are an internally managed investment company that lends to and invests in small and medium-sized companies primarily in connection with other investors. We have elected to be treated as a business development company (“BDC”) under the Investment Company Act of 1940, as amended (the “1940 Act”). As a business development company we are required to comply with certain regulatory requirements. We make the majority of our investments through our wholly-owned subsidiary, Rand Capital SBIC, Inc. (“Rand SBIC”) which operates as a small business investment company (“SBIC”) and has been licensed by the U.S. Small Business Administration (“SBA”) since 2002. We anticipate that most, if not all, of our investments in the next year will be originated through Rand SBIC.
Our investment objective is to achieve long-term capital appreciation on our equity investments while maintaining a current cash flow from our debenture and LLC pass-through equity instruments. Therefore, we invest in a variety of financial instruments to provide a current return on a portion of the investment portfolio. The equity features contained in our investment portfolio are structured to realize capital appreciation over the long-term and typically do not generate current income in the form of dividends or interest.
We look for certain criteria in the companies in which we might invest. These criteria are:
1) a qualified and experienced management team;
2) a new or unique product or service;
3) high potential for growth in revenue and cash flow; and
4) potential to realize appreciation in an equity position, if any.
We typically make initial investments of $500,000 to $1,000,000 directly in a company through equity or debt instruments. The debt instruments generally have a maturity of not more than five years and usually have detachable equity warrants. Interest may be paid currently or deferred, based on the investment structure negotiated.
Our management team identifies investment opportunities through a network of investment referral relationships. Investment proposals may, however, come to us from other sources, including unsolicited proposals from companies and referrals from banks, lawyers, accountants and other members of the financial community. We believe that our reputation in the investment community and experience provide a competitive advantage in originating qualified new investments.
11
In a typical private financing, our management team will review, analyze, and evaluate, through due diligence, the business plan and operations of the potential portfolio company. Additionally, we will familiarize ourselves with the portfolio company’s industry and competition and may conduct reference checks with their customers and suppliers.
Following an initial investment in a portfolio company, we may make follow-on investments in it. Follow-on investments may be made to take advantage of warrants or other preferential rights granted to us to increase or maintain our position in a promising portfolio company, or provide an additional investment to allow a portfolio company to fully implement its business plans, develop a new line of business or recover from unexpected business problems. Follow-on investments in a portfolio company are evaluated individually and may be subject to regulatory restrictions. Pursuant to SBA regulations, the maximum cash which may be invested in one portfolio company by Rand SBIC is currently $2.4 million.
We may exit investments through the maturation of a debt security or when a liquidity event takes place, such as the sale, recapitalization, or initial public offering of a portfolio company. The method and timing of the disposition of our portfolio investments can be critical to the realization of maximum total return. We generally expect to dispose of our equity securities through private sales of securities to other investors or through an outright sale of the company or a merger. We anticipate our debt investments will be repaid with interest and hope to realize further appreciation from the warrants or other equity type instruments we receive in connection with the investment. We fund new investments and operating expenses through existing cash balances, investment returns, and interest and principal payments from our portfolio companies.
2014 Portfolio and Investment Activity
We believe the change in net asset value over time is the leading valuation metric for monitoring our performance. Changes from quarter to quarter, and at any point in time, may vary because of specific activity related to an investment, but the overall growth trend demonstrates the effectiveness of our investment efforts.
| • | Net asset value of our portfolio increased to a record $5.11 per share, or $32.4 million, at December 31, 2014, up $0.73 per share, or 15%, over net asset value of $4.38 per share, or $28.1 million, at the end of the prior year. |
| • | Rand’s investment value is $30.3 million, which reflects $8.1 million in net unrealized appreciation. |
| • | At year end, our portfolio was comprised of 29 active businesses valued at $30.3 million. |
| • | Approximately 20% of the portfolio was debt and loan investments with the remainder being equity investments. |
| • | The portfolio generated approximately $2.6 million in interest, fee, dividend and other income for the Corporation. This was up from $2.5 million for the prior year. |
| • | During 2014, we made $6.3 million in new investments in 14 businesses including follow-on investments in existing portfolio companies. We added seven new portfolio companies during the year. |
| • | During 2014, we had three divestitures or exits from portfolio companies. We realized a net gain before income taxes of $7.2 million mostly as the result of the sale of one portfolio company. |
| • | A portfolio company was sold in the fourth quarter of 2014, for which we received $10.1 million in proceeds, including amounts held in escrow. We had a 4% equity ownership in the company, which we initially invested in 2011. The internal rate of return for this asset was over 75%, representing a 5.6 times return on invested capital. |
Outlook
At the end of 2014, we had $13.2 million in cash for future investments. We believe the combination of cash on hand and prospective investment income provides sufficient capital for us to continue to add new investments
12
to our portfolio while reinvesting in existing portfolio companies that demonstrate continued growth potential. Both short and long-term trends provide us confidence in our ability to grow Rand.
| • | With improving economic conditions in the U.S., we expect that well run businesses should be able to compete effectively given the low cost of capital, strengthened business and consumer spending, and eager reception of new technologies and service concepts. |
| • | We have $13.2 million in cash that we can invest in new opportunities and use to repurchase shares. At year end, we had authorization to repurchase an additional 465,504 shares of our Common Stock under the current program. |
| • | Given our increased scale we are able to invest larger amounts in companies, which will provide an opportunity to accelerate our rate of growth. |
| • | We continue to manage risk by investing with other investors, when possible. |
| • | We are actively involved with the governance and management of our portfolio companies which enables us to support their operating and marketing efforts to facilitate their growth. |
| • | As our portfolio continues to expand, we are able to better leverage our infrastructure. |
Critical Accounting Policies
We prepare our financial statements in accordance with United States generally accepted accounting principles, or GAAP, which require the use of estimates and assumptions that affect the reported amounts of assets and liabilities. For a summary of all significant accounting policies, including critical accounting policies, see Note 1 to the consolidated financial statements in Item 8 of this Annual Report.
The increasing complexity of the business environment and applicable authoritative accounting guidance require us to closely monitor our accounting policies and procedures. We have two critical accounting policies that require the use of significant judgment. The following summary of critical accounting policies is intended to enhance a reader’s ability to assess our financial condition and results of operations and the potential volatility due to changes in estimates.
Valuation of Investments
The most important estimate in the preparation of our consolidated financial statements is the valuation of investments and the resulting unrealized appreciation or depreciation.
Investments are valued at fair value as determined in good faith by management and submitted to the Board of Directors for approval. We invest in loan instruments, debt instruments, and equity instruments and there is no single standard for determining fair value of these investments. As a result, determining fair value requires that judgment be applied to the specific facts and circumstances of each portfolio investment and employing a consistent valuation process. We analyze and value each investment quarterly, and record unrealized depreciation for an investment that we believe has become impaired, including where collection of a loan or realization of the recorded value of an equity security is doubtful. Conversely, we will record unrealized appreciation if we believe that an underlying portfolio company has appreciated in value and, therefore, its equity security has also appreciated in value. These estimated fair values may differ from the values that would have been used had a ready market for the investments existed and these differences could be material if our assumptions and judgments differ from results of actual liquidation events.
Our investments are carried at fair value in accordance with FASB Accounting Standards Codification (ASC) 820, “fair value measurements and disclosures”, which defines fair value, establishes a framework for measuring fair value in accordance with GAAP, and expands disclosures about fair value measurements.
Loan investments are defined as traditional loan financings with no equity features. Debt investments are defined as debt financings that include one or more equity features such as conversion rights, stock purchase warrants, and/or stock purchase options. A financing may also be categorized as a debt financing if it is accompanied by the direct purchase of an equity interest in the company.
13
We use several approaches to determine the fair value of an investment. The main approaches are:
| • | Loan and debt securities are valued at cost when it is representative of the fair value of an investment or sufficient assets or liquidation proceeds are expected to exist from a sale of a portfolio company at its estimated fair value. |
The loan and debt securities may also be valued at an amount other than the price the security would command in order to provide a yield to maturity equivalent to the current yield of similar debt securities. A loan or debt instrument may be reduced in value if it is judged to be of poor quality, collection is in doubt or insufficient liquidation proceeds exist.
| • | Equity securities may be valued using the “market approach” or “income approach.” The market approach uses observable prices and other relevant information generated by similar market transactions. It may include the use of market multiples derived from a set of comparables to assist in pricing the investment. Additionally, we adjust valuations if a subsequent significant equity financing has occurred that includes a meaningful portion of the financing by a sophisticated, unrelated new investor. The income approach employs a cash flow and discounting methodology to value an investment. |
ASC 820 classifies the inputs used to measure fair value into the following hierarchy:
Level 1: Quoted prices in active markets for identical assets or liabilities, used in our valuation at the measurement date.
Level 2: Quoted prices for similar assets or liabilities in active markets, or quoted prices for identical or similar assets or liabilities in markets that are not active, or other observable inputs other than quoted prices.
Level 3: Unobservable and significant inputs to determining the fair value.
Financial assets are categorized based upon the level of judgment associated with the inputs used to measure their fair value.
Any changes in estimated fair value are recorded in the statement of operations as “Net (decrease) increase in unrealized appreciation on investments.”
Under our valuation policy, we value unrestricted publicly traded companies at the average closing bid price for the last three trading days of the quarter.
In the valuation process, we value private securities, categorized as Level 3 investments, using financial information from these portfolio companies, which may include:
| • | Financial information obtained from each portfolio company, including unaudited statements of operations, balance sheets and operating budgets; |
| • | Current and projected financial, operational and technological developments of the portfolio company; |
| • | Current and projected ability of the portfolio company to service its debt obligations; |
| • | The current capital structure of the business and the seniority of the various classes of equity if a deemed liquidation event were to occur; |
| • | Pending debt or capital restructuring of the portfolio company; |
| • | Current information regarding any offers to purchase the investment; or past sales transactions; |
| • | Current ability of the portfolio company to raise additional financing if needed; |
| • | Changes in the economic environment which may have a material impact on the operating results of the portfolio company; |
| • | Internal occurrences that may have an impact (both positive and negative) on the operating performance of the portfolio company; |
14
| • | Qualitative assessment of key management; |
| • | Contractual rights, obligations or restrictions associated with the investment; and |
| • | Other factors deemed relevant to assess valuation. |
This information is used to determine financial condition, performance, and valuation of the portfolio companies. The valuation may be reduced if a portfolio company’s performance and potential have deteriorated. If the factors which led to a reduction in valuation are overcome, the valuation may be readjusted.
Equity Securities
Equity securities, in which we invest, may include preferred stock, common stock, warrants and limited liability company and partnership interests.
The significant unobservable inputs used in the fair value measurement of our equity investments are EBITDA and revenue multiples, where applicable, the financial and operational performance of the business, and the senior equity preferences which may exist in a liquidation event. Standard industry multiples may be used when available; however, our portfolio companies are typically small and in the early stages of development and these industry standards may have to be adjusted to more closely match the specific financial and operational performance of the portfolio company. Due to the nature of certain investments, fair value measurements may be based on other criteria, which may include third party appraisals. Significant changes to the unobservable inputs, such as variances in financial performance from expectations, may result in a significantly higher or lower fair value measurement.
Another key factor used in valuing equity investments is recent arms-length equity transactions with unrelated new investors entered into by the portfolio company. The terms of these equity transactions may not be identical to the equity transactions between us and the portfolio company, and the impact of the difference in transaction terms on the market value of the portfolio company may be difficult or impossible to quantify.
When appropriate, we use Black-Scholes pricing model to estimate the fair value of warrants for accounting purposes. This model requires the use of highly subjective inputs including expected volatility and expected life, in addition to variables for the valuation of minority equity positions in small private and early stage companies. Significant increases or decreases in any of these unobservable inputs would result in a significantly higher or lower fair value measurement.
For recent investments, we generally rely on the cost basis, which is deemed to represent the fair value, unless other fair market value inputs are identified causing us to depart from this basis.
Loans and Debt Securities
The significant unobservable inputs used in the fair value measurement of our loan and debt securities are the financial and operational performance of the portfolio company, similar debt with other portfolio companies, as well as the market acceptance of the portfolio company’s products or services. These inputs will provide an indicator as to the probability of principal recovery of the investment. Our debt investments are often junior secured or unsecured debt securities. Fair value may also be determined based on other criteria where appropriate. Significant changes to the unobservable inputs may result in a change in fair value. For recent investments, we generally rely on the cost basis, which is deemed to represent the fair value, unless other fair market value inputs are identified causing us to depart from this level.
Revenue Recognition
Interest income generally is recognized on the accrual basis except where the investment is in default or otherwise presumed to be in doubt. In such cases, interest income is recognized at the time of receipt. A reserve for possible losses on interest receivable is maintained when appropriate.
Rand SBIC’s interest accrual is also regulated by the SBA’s “Accounting Standards and Financial Reporting Requirements for Small Business Investment Companies.” Under these rules interest income cannot be
15
recognized if collection is doubtful, and a 100% reserve must be established. The collection of interest is presumed to be in doubt when there is substantial doubt about a portfolio company’s ability to continue as a going concern or the loan is in default more than 120 days. Management also uses other qualitative and quantitative measures to determine the value of a portfolio investment and the collectability of any accrued interest.
We hold debt securities in our investment portfolio that contain payment-in-kind (“PIK”) interest provisions. The PIK interest, computed at the contractual rate specified in each debt agreement, is periodically added to the principal balance of the debt and is recorded as interest income. Thus, the actual collection of this interest may be deferred until the time of debt principal repayment.
We may receive distributions from portfolio companies that are limited liability companies or partnerships. These distributions are classified as dividend income on the consolidated statement of operations and are recognized when the amount can be reasonably estimated.
We hold preferred equity securities that contain cumulative dividend provisions. Cumulative dividends are recorded as dividend income, and any dividends in arrears are added to the balance of the preferred equity investment. The actual collection of these dividends in arrears may be deferred until such time as the preferred equity is redeemed.
Financial Condition
Overview:
| 12/31/14 | 12/31/13 | Increase | % Increase | |||||||||||||
| Total assets |
$ | 45,525,987 | $ | 39,750,370 | $ | 5,775,617 | 14.5 | % | ||||||||
| Total liabilities |
13,172,546 | 11,681,038 | 1,491,508 | 12.8 | % | |||||||||||
|
|
|
|
|
|
|
|||||||||||
| Net assets |
$ | 32,353,441 | $ | 28,069,332 | $ | 4,284,109 | 15.3 | % | ||||||||
|
|
|
|
|
|
|
|||||||||||
Net asset value was $5.11 per share at December 31, 2014 versus $4.38 per share at December 31, 2013.
During 2014, we drew down $1,000,000 of additional SBA leverage. The outstanding SBA leverage at December 31, 2014 is $8,000,000, which will mature from 2022 through 2025.
Cash approximated 41% of net assets at December 31, 2014 compared to 35% at December 31, 2013.
Composition of the Investment Portfolio
Our financial condition is dependent on the success of our portfolio holdings. We have invested substantially all of our assets in small to medium-sized companies. The following summarizes our investment portfolio at the year-ends indicated.
| 12/31/14 | 12/31/13 | Increase (Decrease) |
%
Increase (Decrease) |
|||||||||||||
| Investments, at cost |
$ | 22,213,476 | $ | 19,894,810 | $ | 2,318,666 | 11.7 | % | ||||||||
| Unrealized appreciation, net |
8,091,900 | 8,453,743 | (361,843 | ) | (4.3 | %) | ||||||||||
|
|
|
|
|
|
|
|||||||||||
| Investments, at fair value |
$ | 30,305,376 | $ | 28,348,553 | $ | 1,956,823 | 6.9 | % | ||||||||
|
|
|
|
|
|
|
|||||||||||
| Number of Portfolio Companies |
29 | 26 | ||||||||||||||
Our total investments at fair value, as estimated by management and approved by the Board of Directors, approximated 94% of net assets at December 31, 2014 and 101% of net assets at December 31, 2013.
16
The change in investments, at cost, during the year ended December 31, 2014, is comprised of the following:
| Cost
Increase (Decrease) |
||||
| New investments: |
||||
| Teleservices Solutions Holdings, LLC (Teleservices Holdings) |
$ | 1,330,000 | ||
| SocialFlow, Inc. (Socialflow) |
750,000 | |||
| Chequed.com, Inc. (Chequed) |
600,000 | |||
| Empire Genomics, LLC (Empire Genomics) |
600,000 | |||
| Crashmob, Inc. (Crashmob) |
500,000 | |||
| SciAps, Inc. (Sciaps) |
500,000 | |||
| Knoa Software, Inc. (Knoa) |
477,764 | |||
| CrowdBouncer, Inc. (Crowdbouncer) |
300,000 | |||
| Knowledge Vison Inc. (Knowledge Vision) |
300,000 | |||
| OnCore Golf Technology, Inc. (Oncore) |
200,000 | |||
| GiveGab, Inc. (Give Gab) |
153,388 | |||
| BeetNPath, LLC (Beetnpath) |
150,000 | |||
| Mercantile Adjustment Bureau, LLC (Mercantile) |
150,000 | |||
| Kinex Pharmaceuticals, Inc. (Kinex) |
143,285 | |||
| First Wave Products Group, LLC (First Wave) |
80,000 | |||
|
|
|
|||
| Total of new investments |
6,234,437 | |||
| Other changes to investments: |
||||
| QuaDPharma, LLC (Quadpharma) exchange of membership interest for common shares of Kinex |
(143,285 | ) | ||
| First Wave interest conversion and OID amortization |
90,844 | |||
| Teleservices Holdings dividend conversion |
70,680 | |||
| Mercantile interest conversion and OID amortization |
63,704 | |||
| Knoa interest conversion |
1,391 | |||
|
|
|
|||
| Total of other changes to investments |
83,334 | |||
| Investments repaid, sold or liquidated |
||||
| BinOptics Corporation (Binoptics) |
(1,799,999 | ) | ||
| EmergingMed.com, Inc. (Emerging Med) |
(778,253 | ) | ||
| QuaDPharma, LLC (Quadpharma) repayment |
(763,001 | ) | ||
| Gemcor II, LLC (Gemcor) repayment |
(287,518 | ) | ||
| Synacor, Inc. (Synacor) |
(239,998 | ) | ||
| Carolina Skiff LLC (Carolina Skiff) repayment |
(125,000 | ) | ||
| NDT Acquisitions, LLC (NDT) |
(5,336 | ) | ||
|
|
|
|||
| Total of investments repaid, sold or liquidated |
(3,999,105 | ) | ||
|
|
|
|||
| Net change in investments, at cost |
$ | 2,318,666 | ||
|
|
|
|||
17
Our top five portfolio companies represented 38% of total assets at December 31, 2014:
| Company |
Industry |
Fair Value at December 31, 2014 |
% of Total Assets at December 31, 2014 |
|||||||
| Gemcor |
Manufacturing — Aerospace Machinery | $ | 9,922,800 | 22 | % | |||||
| Rheonix |
Health Care — Testing Devices | $ | 2,235,999 | 5 | % | |||||
| Microcision |
Manufacturing — Medical Products | $ | 1,891,965 | 4 | % | |||||
| Carolina Skiff |
Consumer Products — Boats | $ | 1,710,000 | 4 | % | |||||
| Chequed |
Software | $ | 1,633,222 | 3 | % | |||||
Our top five portfolio companies represented 45% of total assets at December 31, 2013:
| Company |
Industry |
Fair Value at December 31, 2013 |
% of Total Assets at December 31, 2013 |
|||||||
| Gemcor |
Manufacturing — Aerospace Machinery | $ | 10,210,319 | 26 | % | |||||
| Rheonix |
Health Care — Testing Devices | $ | 2,235,999 | 6 | % | |||||
| Microcision |
Manufacturing — Medical Products | $ | 1,891,965 | 5 | % | |||||
| Carolina Skiff |
Consumer Products — Boats | $ | 1,835,000 | 5 | % | |||||
| BinOptics |
Manufacturing —Semiconductor | $ | 1,799,999 | 5 | % | |||||
Below is the geographic breakdown of our investments at fair value as of December 31, 2014 and 2013:
| Geographic Region |
% of Net Asset
Value at December 31, 2014 |
% of Net Asset
Value at December 31, 2013 |
||||||
| USA – East |
89 | % | 94 | % | ||||
| USA – South |
5 | % | 7 | % | ||||
|
|
|
|
|
|||||
| 94 | % | 101 | % | |||||
|
|
|
|
|
|||||
As of December 31, 2014 and 2013, the investment portfolio consisted of the following investments:
| Cost | Percentage of Total Portfolio |
Fair Value | Percentage of Total Portfolio |
|||||||||||||
| December 31, 2014: |
||||||||||||||||
| Subordinated Debt and Promissory Notes |
$ | 4,807,140 | 22 | % | $ | 4,807,140 | 16 | % | ||||||||
| Convertible Debt |
1,200,000 | 6 | 1,200,000 | 4 | ||||||||||||
| Equity and Membership Interests |
16,086,711 | 72 | 24,178,611 | 80 | ||||||||||||
| Equity Warrants |
119,625 | — | 119,625 | — | ||||||||||||
|
|
|
|
|
|
|
|
|
|||||||||
| Total |
$ | 22,213,476 | 100 | % | $ | 30,305,376 | 100 | % | ||||||||
|
|
|
|
|
|
|
|
|
|||||||||
18
| Cost | Percentage of Total Portfolio |
Fair Value | Percentage of Total Portfolio |
|||||||||||||
| December 31, 2013: |
||||||||||||||||
| Subordinated Debt and Promissory Notes |
$ | 6,217,274 | 31 | % | $ | 5,439,021 | 19 | % | ||||||||
| Convertible Debt |
200,000 | 1 | 200,000 | 1 | ||||||||||||
| Equity and Membership Interests |
13,405,536 | 68 | 22,637,532 | 80 | ||||||||||||
| Equity Warrants |
72,000 | — | 72,000 | — | ||||||||||||
|
|
|
|
|
|
|
|
|
|||||||||
| Total |
$ | 19,894,810 | 100 | % | $ | 28,348,553 | 100 | % | ||||||||
|
|
|
|
|
|
|
|
|
|||||||||
Results of Operations
Investment Income
Our investment objective is to achieve long-term capital appreciation on our equity investments while investing in a mixture of debenture and equity instruments, which may provide a current return on a portion of the investment portfolio. The equity features contained in our investment portfolio are structured to realize capital appreciation over the long-term.
Comparison of the years ended December 31, 2014 and 2013
Investment income increased 5%, or $133,439, from $2,451,036 for the year ended December 31, 2013 to $2,584,475 for the year ended December 31, 2014. The net increase was primarily attributable to an increase in dividend income.
| December 31, 2014 |
December 31, 2013 |
(Decrease) Increase |
%
(Decrease) Increase |
|||||||||||||
| Interest from portfolio companies |
$ | 789,548 | $ | 793,071 | ($ | 3,523 | ) | 0 | % | |||||||
| Interest from other investments |
14,288 | 10,932 | 3,356 | 31 | % | |||||||||||
| Dividend and other investment income |
1,750,439 | 1,623,633 | 126,806 | 8 | % | |||||||||||
| Fee income |
30,200 | 23,400 | 6,800 | 29 | % | |||||||||||
|
|
|
|
|
|
|
|||||||||||
| Total investment income |
$ | 2,584,475 | $ | 2,451,036 | $ | 133,439 | 5 | % | ||||||||
|
|
|
|
|
|
|
|||||||||||
Interest from portfolio companies — Our portfolio interest income decreased slightly during 2014 due to the decrease in principal balances on loan and debt investments with Gemcor, II, LLC and Carolina Skiff, LLC, respectively. This decrease was partially offset because we originated over $1.8 million in new debt instruments during the previous 18 months with interest rates ranging from 6% to 13%. After reviewing the portfolio company’s performance and the circumstances surrounding the investment, we ceased accruing interest income on Mezmeriz during 2014.
Interest from other investments — The minor increase in interest from other investments was primarily due to higher average cash balances during the year ended December 31, 2014 versus the year ended December 31, 2013. The cash balances at December 31, 2014 and 2013 were $13,230,717 and $9,764,810, respectively.
Dividend and other investment income — Dividend income is comprised of distributions from limited liability companies (LLCs) in which we have invested. Our investment agreements with certain LLCs require the LLCs’ to distribute funds to us for payment of income taxes on our allocable share of the LLC’s profits. These portfolio companies may also elect to distribute additional discretionary distributions. Dividend income will fluctuate based upon the profitability of these LLCs and the timing of the distributions.
Dividend income for the year ended December 31, 2014 consisted of distributions from Gemcor II, LLC (Gemcor) of $1,508,822, Teleservices Solutions Holdings, LLC (Teleservices) of $98,952, Carolina Skiff LLC (Carolina Skiff) of $54,089, New Monarch Machine Tool, Inc. (Monarch) of $45,682, Advantage 24/7 LLC (Advantage) of $37,695, NDT Acquisition LLC (NDT) of $2,668 and Somerset Gas Transmission Company,
19
LLC (Somerset) of $2,531. Dividend income for the year ended December 31, 2013 consisted of distributions from Gemcor of $1,481,675, Monarch of $68,522, Carolina Skiff of $56,239, Somerset of $16,670 and NDT of $527.
Fee income — Fee income consists of the revenue associated with the amortization of financing fees charged to the portfolio companies upon successful closing of Rand SBIC financings and income associated with portfolio company board attendance fees. The financing fees are amortized ratably over the life of the instrument associated with the fees. The unamortized fees are carried on the balance sheet under “Deferred revenue.”
The amortization of financing fees was $16,200 and $7,400 for the years ended December 31, 2014 and 2013, respectively. The financing fee income based on the existing portfolio is expected to be approximately $14,000 in 2015, $6,000 in 2016 and $4,000 in 2017.
Fees paid for board service at the portfolio companies were $14,000 and $16,000 for the years ended December 31, 2014 and 2013, respectively.
Comparison of the years ended December 31, 2013 and 2012
Investment income decreased 6%, or $153,585, from $2,604,621 for the year ended December 31, 2012 to $2,451,036 for the year ended December 31, 2013. The net decrease was primarily attributable to a decrease in the dividend income distributed.
| December 31, 2013 |
December 31, 2012 |
Increase (Decrease) |
% Increase (Decrease) |
|||||||||||||
| Interest from portfolio companies |
$ | 793,071 | $ | 624,581 | $ | 168,490 | 27 | % | ||||||||
| Interest from other investments |
10,932 | 9,282 | 1,650 | 18 | % | |||||||||||
| Dividend and other investment income |
1,623,633 | 1,957,621 | (333,988 | ) | (17 | %) | ||||||||||
| Fee income |
23,400 | 13,137 | 10,263 | 78 | % | |||||||||||
|
|
|
|
|
|
|
|||||||||||
| Total investment income |
$ | 2,451,036 | $ | 2,604,621 | ($ | 153,585 | ) | (6 | %) | |||||||
|
|
|
|
|
|
|
|||||||||||
Interest from portfolio companies — The portfolio interest income increase was due to the fact we originated over $2.5 million in new debt instruments during the previous 18 months with interest rates ranging from 8% to 15%.
After reviewing the portfolio companies’ performance and the circumstances surrounding the investments, we ceased accruing interest income on Emerging Med and Mid America Brick during 2012.
Interest from other investments — The minor increase in interest from other investments was primarily due to higher average cash balances during the year ended December 31, 2013 versus the year ended December 31, 2012. The cash balances at December 31, 2013 and 2012 were $9,764,810 and $4,224,763, respectively.
Dividend and other investment income — Dividend income is comprised of distributions from limited liability companies (LLCs) in which we have invested. Our investment agreements with certain LLCs require the LLCs to distribute funds to us for payment of income taxes on our allocable share of the LLC’s profits. These portfolio companies may also elect to distribute additional discretionary distributions. Dividend income will fluctuate based upon the profitability of the LLCs and the timing of the distributions.
Dividend income for the year ended December 31, 2013 consisted of distributions from Gemcor of $1,481,675, Monarch of $68,522, Carolina Skiff of $56,239, Somerset of $16,670 and NDT of $527. Dividend income for the year ended December 31, 2012 consisted of distributions from Gemcor of $1,733,806, Monarch of $191,864, Carolina Skiff of $24,079, Somerset of $6,950 and NDT of $922.
Fee income — Fee income consists of the revenue associated with the amortization of financing fees charged to the portfolio companies upon successful closing of Rand SBIC financings and income associated with portfolio company board attendance fees. The financing fees are amortized ratably over the life of the instrument associated with the fees. The unamortized fees are carried on the balance sheet under “Deferred revenue.”
The income associated with the amortization of financing fees was $7,400 and $2,136 for the years ended December 31, 2013 and 2012, respectively.
20
Fees for board service at portfolio companies were $16,000 and $11,000 for the years ended December 31, 2013 and 2012, respectively.
Expenses
Comparison of the years ended December 31, 2014 and 2013
| December 31, 2014 |
December 31, 2013 |
Increase | % Increase | |||||||||||||
| Total expenses |
$ | 2,499,297 | $ | 2,359,252 | $ | 140,045 | 6 | % | ||||||||
Operating expenses predominately consist of compensation expense and related benefits, interest expense on outstanding SBA borrowings, and general and administrative expenses including shareholder and office expenses and professional fees.
The 6%, or $140,045, increase in operating expenses for the year ended December 31, 2014 as compared to the same period in 2013 is due, in part, to the fact that the we had a bad debt recovery of $64,654 during the year ended December 31, 2013, whereas we incurred a bad debt expense of $6,311 for the year ended December 31, 2014. In addition, the SBA borrowings increased from $7,000,000 at December 31, 2013 to $8,000,000 at December 31, 2014, causing a 41%, or $77,868, increase in SBA interest expense for the year ended December 31, 2014 as compared to the year ended December 31, 2013. During the year ended December 31, 2014 we accrued $899,500 in profit sharing obligations and $91,490 in bonus expense. For the year ended December 31, 2013 we accrued $887,244 in profit sharing obligations and $80,000 in bonus expense.
Comparison of the years ended December 31, 2013 and 2012
| December 31, 2013 |
December 31, 2012 |
Increase | % Increase | |||||||||||||
| Total expenses |
$ | 2,359,252 | $ | 1,795,600 | $ | 563,652 | 31 | % | ||||||||
The increase in operating expenses during the year ended December 31, 2013 is comprised primarily of a $595,244 increase in Bonus and Profit Sharing expense, a $63,335 increase in Employee Benefit expense and a $53,340 increase in Salary expense. Bonus and Profit Sharing expense increased due to the accrual of $887,244 in profit sharing obligations and $80,000 in bonus expense for the year ended December 31, 2013 attributed to the increase in realized gains during 2013. For the year ended December 31, 2012, we accrued $246,000 in profit sharing obligations and $136,000 in bonus expense. These expense increases are offset by a $139,449 decrease in Bad Debt expense. Bad debt (recovery) expense was ($64,654) and $74,795 for the years ended December 31, 2013 and 2012, respectively.
Net Realized Gains and Losses on Investments
Comparison of the years ended December 31, 2014 and 2013
| December 31, 2014 |
December 31, 2013 |
Increase | % Increase | |||||||||||||
| Net realized gain on sales and dispositions, before income taxes |
$ | 7,237,937 | $ | 7,034,180 | $ | 203,757 | 3 | % | ||||||||
BinOptics Corporation was sold to a strategic acquirer during the fourth quarter of 2014 and we received approximately $10.1 million in net proceeds for our equity securities. The realized gain from the sale was $8,333,344 and included $1,510,248 that was held in escrow at December 31, 2014. The escrow holdback is recorded in “Other Assets” on the accompanying consolidated statement of financial position. The escrow is scheduled to be released during 2016, subject to potential claims.
We sold our investment in QuaDPharma, LLC (Quadpharma) to Kinex Pharmaceuticals, Inc. (Kinex) during 2014 and received $923,634 in net cash proceeds for the debt and equity securities and recognized a realized gain of $160,634. As part of the sale, we received 11,574 common shares of Kinex that had a fair value of $254,628 at December 31, 2014 and resulted in an unrealized gain of $111,343.
21
During the year ended December 31, 2014, we recognized a net realized loss of $9,792 on the sale of 127,061 shares of Synacor, Inc. (Synacor). Synacor trades on the NASDAQ Global Market under the symbol “SYNC”. As of December 31, 2014, we owned 301,582 shares of Synacor.
In addition, during the year ended December 31, 2014, we recognized a realized loss of $778,253 on Emerging Med. It was sold during January 2014 and we did not receive any proceeds from the sale. This investment had been valued at $0 at December 31, 2013. We also recognized a realized loss of $472,664 on an adjustment to the Liazon Corporation escrow receivable and a gain of $4,668 on an adjustment to the Ultra-Scan escrow receivable.
Comparison of the years ended December 31, 2013 and 2012
| December 31, 2013 |
December 31, 2012 |
Increase | % Increase | |||||||||||||
| Net realized gain on sales and dispositions, before income taxes |
$ | 7,034,180 | $ | 1,334,118 | $ | 5,700,062 | 427 | % | ||||||||
Liazon Corporation was sold during 2013 and we received approximately $7.4 million in net proceeds for our equity securities. The realized gain from the sale was $6,256,482 and included $1,153,277 that was held in escrow at December 31, 2013 in “Other Assets” on the accompanying consolidated statement of financial position. The escrow was adjusted and released during 2014.
During the year ended December 31, 2013, we recognized a net realized gain of $1,164,545 on the sale of 252,200 shares of Synacor, Inc. (Synacor). Synacor trades on the NASDAQ Global Market under the symbol “SYNC”. As of December 31, 2013, we owned 428,643 shares of Synacor.
We also recognized a realized gain of $669,939 on the sale of our shares in Ultra-Scan to a strategic acquirer during the year ended December 31, 2013 which included $181,141 held in escrow. The escrow was partially released in 2014 and is scheduled to be fully released during 2015.
We realized a loss of $1,063,698 on our investment in Mid-America Brick during the year ended December 31, 2013 when the company announced in February 2013 that it had filed for bankruptcy. Due to the subordinated nature of our investment security no recovery was received.
Change in Net Unrealized Appreciation of Investments
For the years ended December 31, 2014 and 2013
| December 31, 2014 |
December 31, 2013 |
Increase | % Increase | |||||||||||||
| Change in net unrealized appreciation before income taxes |
($ | 361,844 | ) | ($ | 2,833,984 | ) | $ | 2,472,140 | 87 | % | ||||||
The change in unrealized appreciation for the year ended December 31, 2014 was comprised of the following:
| Valuation Change during 2014 |
||||
| Reclass EmergingMed.com, Inc. (Emerging Med) to a realized loss |
$ | 778,253 | ||
| Kinex Pharmaceuticals, Inc. (Kinex) |
111,343 | |||
| NDT Acquisitions, LLC (NDT) |
5,336 | |||
| Synacor, Inc. (Synacor) |
(208,503 | ) | ||
| CrowdBouncer, Inc.(Crowdbouncer) |
(300,000 | ) | ||
| Knoa Software, Inc. (Knoa) |
(356,900 | ) | ||
| Mezmeriz, Inc. (Mezmeriz) |
(391,373 | ) | ||
|
|
|
|||
| Total change in net unrealized appreciation during the year ended December 31, 2014 |
($ | 361,844 | ) | |
|
|
|
|||
22
The Emerging Med investment was written off during the year ended December 31, 2014, after the company was sold and we did not receive proceeds.
The Kinex shares were received as part of the sale of Quadpharma. The proceeds from this sale included cash and Kinex stock. The value of the Kinex stock was based on a 2014 equity financing by Kinex.
The NDT investment value was adjusted for royalties received.
Synacor, as a publicly traded stock, is marked to market at the end of each quarter. We valued our 301,582 shares of Synacor at a three-day average bid price of $2.01 as of December 31, 2014.
The Crowdbouncer and Mezmeriz investments were revalued during 2014 after our management reviewed the portfolio companies and their financials and determined that both of the businesses had deteriorated since the time of our original funding. Both portfolio companies remain in operation and are developing new business strategies.
The valuation of Knoa was decreased during the year ended December 31, 2014 to value our equity holdings at the most recent insider round of financing.
The change in unrealized appreciation for the year ended December 31, 2013 was comprised of the following items:
| Valuation Change during 2013 |
||||
| Reclass Mid America Brick & Structural Clay Products, LLC (Mid America Brick) to a realized loss |
$ | 1,063,698 | ||
| Carolina Skiff LLC (Carolina Skiff) |
350,000 | |||
| NDT |
19,178 | |||
| Emerging Med |
(440,707 | ) | ||
| Reclass Ultra-Scan Corporation (Ultra-Scan) to realized gain |
(561,836 | ) | ||
| Reclass Liazon Corporation (Liazon) to realized gain |
(975,133 | ) | ||
| Synacor |
(2,289,184 | ) | ||
|
|
|
|||
| Total change in net unrealized appreciation during the year ended December 31, 2013 |
($ | 2,833,984 | ) | |
|
|
|
|||
The Mid America Brick investment was written off after the company filed for bankruptcy protection in the first quarter of 2013.
Carolina Skiff’s value was adjusted based on a financial analysis of the portfolio company indicating continued improved performance.
The NDT investment value was adjusted for royalties received.
The Emerging Med investment was written down based on a financial analysis of the company and to reflect anticipated liquidation proceeds.
Synacor, as a publicly traded stock, is marked to market at the end of each quarter. We valued our 428,643 shares of Synacor at a three-day average bid price of $2.46 at December 31, 2013.
For the years ended December 31, 2013 and 2012
| December 31, 2013 |
December 31, 2012 |
Decrease | % Decrease | |||||||||||||
| Change in net unrealized appreciation before income taxes |
($ | 2,833,984 | ) | $ | 764,548 | ($ | 3,598,532 | ) | (471 | %) | ||||||
23
The decrease in net unrealized appreciation for the year ended December 31, 2013 was comprised of the following items:
| Valuation Change during 2013 |
||||
| Reclass Mid America Brick to a realized loss |
$ | 1,063,698 | ||
| Carolina Skiff LLC (Carolina Skiff) |
350,000 | |||
| NDT |
19,178 | |||
| Emerging Med |
(440,707 | ) | ||
| Reclass Ultra-Scan Corporation (Ultra-Scan) to realized gain |
(561,836 | ) | ||
| Reclass Liazon Corporation (Liazon) to realized gain |
(975,133 | ) | ||
| Synacor |
(2,289,184 | ) | ||
|
|
|
|||
| Total change in net unrealized appreciation during the year ended December 31, 2013 |
($ | 2,833,984 | ) | |
|
|
|
|||
The Mid America Brick investment was written off after the company filed for bankruptcy protection in the first quarter of 2013.
Carolina Skiff’s value was adjusted based on a financial analysis of the portfolio company indicating continued improved performance.
The NDT investment value was adjusted for royalties received.
The Emerging Med investment was written down based on a financial analysis of the company and to reflect anticipated liquidation proceeds.
Synacor, as a publicly traded stock, is marked to market at the end of each quarter. We valued the 428,643 shares of Synacor at a three-day average bid price of $2.46 at December 31, 2013.
The increase in net unrealized appreciation for the year ended December 31, 2012 was comprised of the following items:
| Valuation Change during 2012 |
||||
| Gemcor II, LLC (Gemcor) |
$ | 2,175,000 | ||
| Liazon |
833,332 | |||
| Ultra-Scan |
561,836 | |||
| Carolina Skiff |
235,000 | |||
| Reclass SmartPill Corp. (SmartPill) to a realized loss |
17,653 | |||
| NDT |
(24,514 | ) | ||
| Emerging Med |
(337,546 | ) | ||
| Mid America Brick |
(1,063,698 | ) | ||
| Synacor |
(1,632,515 | ) | ||
|
|
|
|||
| Total change in net unrealized appreciation during the year ended December 31, 2012 |
$ | 764,548 | ||
|
|
|
|||
The fair values of the Gemcor, Ultra-Scan and Carolina Skiff investments were increased based on improvements in their respective businesses during 2012.
In accordance with our valuation policy, we increased the value of our holdings in Liazon based on another significant equity financing during 2012 by a new non-strategic outside investor that had a higher valuation for Liazon than in prior financing rounds.
24
The Mid America Brick investment was written down during 2012 after a review by our management of its financials and an analysis of the liquidation preferences of senior securities. The NDT and Emerging Med investments were written down based on a financial analysis of each company.
Synacor, as a publicly traded stock, is marked to market at the end of each quarter. The stock had restrictions on its sale that expired on August 11, 2012. We valued our 680,843 shares of Synacor at the three-day average bid price of $5.20 at December 31, 2012.
All of these value adjustments resulted from a review by management using the guidance set forth by ASC 820 and our established valuation policy.
Net Increase (Decrease) in Net Assets from Operations
We account for our operations under GAAP for investment companies. The principal measure of our financial performance is “net increase in net assets from operations” on our consolidated statements of operations. During the year ended December 31, 2014, the net increase in net assets from operations was $4,541,481 as compared with net increases of $2,873,357 in 2013 and $1,939,767 in 2012.
Liquidity and Capital Resources
Our principal objective is to achieve capital appreciation. Therefore, a significant portion of the investment portfolio is structured to maximize the potential for capital appreciation and may provide little or no current yield in the form of dividends or interest payments.
As of December 31, 2014, our total liquidity was $13,230,717 in cash.
Net cash provided by operating activities has averaged approximately $399,100 over the last three years and management anticipates that cash will continue to be provided at similar levels. The cash flow may fluctuate based on dividend income, realized gains and the associated income taxes paid.
Our net cash flow provided by investing activities was approximately $4,100,700 and $4,670,300 for fiscal years 2014 and 2013, respectively and this is attributable to the exit of portfolio investments. We used approximately $3,598,000 during fiscal year 2012 in investing activities. We will generally use cash in investing activities as we build our portfolio utilizing our available cash and proceeds from liquidations of portfolio investments. We anticipate that we will continue to exit investments over the next several years. However, liquidation events within the portfolio are difficult to project with any certainty.
The following table summarizes the SBA leverage at December 31, 2014 and December 31, 2013:
| 12/31/14 | 12/31/13 | |||||||
| Outstanding SBA leverage |
$ | 8,000,000 | $ | 7,000,000 | ||||
| Outstanding SBA commitment |
— | $ | 1,000,000 | |||||
The following table summarizes the cash to be received over the next five years from portfolio companies based on contractual obligations as of December 31, 2014. This table does not include any escrow receivable amounts. These payments represent scheduled principal and interest payments that are due under the terms of the investment securities we own in each portfolio company.
| Cash Receipts due by year | ||||||||||||||||||||
| 2015 | 2016 | 2017 | 2018 | 2019 and beyond |
||||||||||||||||
| Scheduled Cash Receipts from Portfolio Companies |
$ | 1,590,000 | $ | 2,190,000 | $ | 3,310,000 | $ | 200,000 | $ | — | ||||||||||
The preceding table only includes debenture instruments and does not include any equity investments which may provide additional proceeds upon exit of the investment.
Management expects that the cash at December 31, 2014, coupled with the scheduled interest payments on our portfolio investments, will be sufficient to meet our cash needs throughout 2015. We are also evaluating
25
potential exits from portfolio companies to increase the amount of liquidity available for new investments, operating activities and future SBA debenture obligations.
Contractual Obligations
The following table shows our specified contractual obligations at December 31, 2014. We do not have any capital lease obligations or other long-term liabilities reflected on our statement of financial position.
| Payments due by period | ||||||||||||||||||||
| Total | Less than 1 year |
1-3 years | 3-5 years | More than 5 yrs |
||||||||||||||||
| SBA Debentures |
$ | 8,000,000 | $ | 0 | $ | 0 | $ | 0 | $ | 8,000,000 | ||||||||||
| SBA Interest Expense |
$ | 2,582,000 | $ | 289,000 | $ | 866,000 | $ | 578,000 | $ | 849,000 | ||||||||||
| Operating Lease Obligations (Rent of office space) |
$ | 113,900 | $ | 18,200 | $ | 56,500 | $ | 39,200 | $ | 0 | ||||||||||
|
|
|
|
|
|
|
|
|
|
|
|||||||||||
| Total |
$ | 10,695,900 | $ | 307,200 | $ | 922,500 | $ | 617,200 | $ | 8,849,000 | ||||||||||
|
|
|
|
|
|
|
|
|
|
|
|||||||||||
Item 7A. Quantitative and Qualitative Disclosures about Market Risk
Our investment activities contain elements of risk. The portion of our investment portfolio consisting of equity and debt securities in private companies is subject to valuation risk. Because there is typically no public market for the equity and debt securities in which we invest, the valuation of the equity interests in the portfolio is stated at “fair value” as determined in good faith by our management and approved by our Board of Directors. This is in accordance with our investment valuation policy. (The discussion of valuation policy contained in “Note 1- Summary of Significant Accounting Policies — Investments” in the consolidated financial statements contained in Item 8 of this report is incorporated herein by reference.) In the absence of readily ascertainable market values, the estimated value of the portfolio may differ significantly from the values that would be placed on the portfolio if a ready market for the investments existed. Any changes in valuation are recorded on the consolidated statement of operations as “Net unrealized appreciation on investments.”
At times a portion of our portfolio may include marketable securities traded in the over-the-counter market. In addition, there may be a portion of the portfolio for which no regular trading market exists. In order to realize the full value of a security, the market must trade in an orderly fashion or a willing purchaser must be available when a sale is to be made. Should an economic or other event occur that would not allow markets to trade in an orderly fashion, we may not be able to realize the fair value of our marketable investments or other investments in a timely manner.
As of December 31, 2014, we did not have any off-balance sheet arrangements or hedging or similar derivative financial instrument investments.
26
Item 8. Financial Statements and Supplementary Data
The following consolidated financial statements and consolidated supplemental schedule of the Corporation and report of Independent Registered Public Accounting Firm thereon are set forth below:
27
RAND CAPITAL CORPORATION AND SUBSIDIARY
CONSOLIDATED STATEMENTS OF FINANCIAL POSITION
December 31,
| 2014 | 2013 | |||||||
| ASSETS |
||||||||
| Investments at fair value: |
||||||||
| Control investments (cost of $ 1,347,300 and $1,640,156, respectively) |
$ | 10,022,300 | $ | 10,309,819 | ||||
| Affiliate investments (cost of $15,188,935 and $12,844,406, respectively) |
14,617,378 | 12,542,869 | ||||||
| Non-affiliate investments (cost of $5,677,241 and $5,410,248, respectively) |
5,665,698 | 5,495,865 | ||||||
|
|
|
|
|
|||||
| Total investments, at fair value (cost of $22,213,476 and $19,894,810, respectively) |
30,305,376 | 28,348,553 | ||||||
| Cash |
13,230,717 | 9,764,810 | ||||||
| Interest receivable (net of allowance: 2014: $128,311 and 2013 — $122,000) |
165,094 | 58,093 | ||||||
| Other assets |
1,824,800 | 1,578,914 | ||||||
|
|
|
|
|
|||||
| Total assets |
$ | 45,525,987 | $ | 39,750,370 | ||||
|
|
|
|
|
|||||
| LIABILITIES AND STOCKHOLDERS’ EQUITY (NET ASSETS) |
||||||||
| Liabilities: |
||||||||
| Debentures guaranteed by the SBA |
$ | 8,000,000 | $ | 7,000,000 | ||||
| Income tax payable |
2,065,795 | 1,223,427 | ||||||
| Deferred tax liability |
1,838,351 | 2,206,808 | ||||||
| Profit sharing and bonus payable |
953,490 | 887,244 | ||||||
| Accounts payable and accrued expenses |
290,646 | 337,095 | ||||||
| Deferred revenue |
24,264 | 26,464 | ||||||
|
|
|
|
|
|||||
| Total liabilities |
13,172,546 | 11,681,038 | ||||||
| Commitments and contingencies (See Note 9) |
||||||||
| Stockholders’ equity (net assets): |
||||||||
| Common stock, $.10 par; shares authorized 10,000,000; shares issued 6,863,034; shares outstanding of 6,328,538 as of 12/31/14 and 6,411,918 as of 12/31/13 |
686,304 | 686,304 | ||||||
| Capital in excess of par value |
10,581,789 | 10,581,789 | ||||||
| Accumulated net investment (loss) |
(867,482 | ) | (889,317 | ) | ||||
| Undistributed net realized gain on investments |
18,290,374 | 13,522,890 | ||||||
| Net unrealized appreciation on investments |
5,109,947 | 5,357,785 | ||||||
| Treasury stock, at cost; 534,496 shares as of 12/31/14 and 451,116 shares as of 12/31/13 |
(1,447,491 | ) | (1,190,119 | ) | ||||
|
|
|
|
|
|||||
| Total stockholders’ equity (net assets) (per share 2014: $5.11, 2013: $4.38) |
32,353,441 | 28,069,332 | ||||||
|
|
|
|
|
|||||
| Total liabilities and stockholders’ equity |
$ | 45,525,987 | $ | 39,750,370 | ||||
|
|
|
|
|
|||||
See accompanying notes
28
RAND CAPITAL CORPORATION AND SUBSIDIARY
CONSOLIDATED STATEMENTS OF OPERATIONS
For The Years Ended December 31, 2014, 2013 and 2012
| 2014 | 2013 | 2012 | ||||||||||
| Investment income: |
||||||||||||
| Interest from portfolio companies: |
||||||||||||
| Control investments |
$ | 112,218 | $ | 154,695 | $ | 78,132 | ||||||
| Affiliate investments |
481,649 | 491,339 | 488,016 | |||||||||
| Non-Control/Non-Affiliate investments |
195,681 | 147,037 | 58,433 | |||||||||
|
|
|
|
|
|
|
|||||||
| Total interest from portfolio companies |
789,548 | 793,071 | 624,581 | |||||||||
| Interest from other investments: |
||||||||||||
| Non-Control/Non-Affiliate investments |
14,288 | 10,932 | 9,282 | |||||||||
|
|
|
|
|
|
|
|||||||
| Total interest from other investments |
14,288 | 10,932 | 9,282 | |||||||||
| Dividend and other investment income: |
||||||||||||
| Control investments |
1,549,185 | 1,482,202 | 1,734,728 | |||||||||
| Affiliate investments |
198,723 | 124,761 | 215,943 | |||||||||
| Non-Control/Non-Affiliate investments |
2,531 | 16,670 | 6,950 | |||||||||
|
|
|
|
|
|
|
|||||||
| Total dividend and other investment income |
1,750,439 | 1,623,633 | 1,957,621 | |||||||||
|
|
|
|
|
|
|
|||||||
| Fee income: |
||||||||||||
| Control investments |
12,000 | 14,000 | 8,000 | |||||||||
| Affiliate investments |
8,866 | 4,400 | 3,666 | |||||||||
| Non-Control/Non-Affiliate investments |
9,334 | 5,000 | 1,471 | |||||||||
|
|
|
|
|
|
|
|||||||
| Total fee income |
30,200 | 23,400 | 13,137 | |||||||||
|
|
|
|
|
|
|
|||||||
| Total investment income |
2,584,475 | 2,451,036 | 2,604,621 | |||||||||
|
|
|
|
|
|
|
|||||||
| Operating expenses: |
||||||||||||
| Salaries |
590,675 | 541,500 | 488,160 | |||||||||
| Bonus and profit sharing |
936,344 | 967,244 | 382,000 | |||||||||
| Employee benefits |
169,808 | 233,967 | 170,632 | |||||||||
| Directors’ fees |
112,500 | 101,250 | 99,750 | |||||||||
| Professional fees |
164,740 | 126,612 | 150,105 | |||||||||
| Stockholders and office operating |
133,505 | 135,483 | 128,872 | |||||||||
| Insurance |
35,709 | 34,304 | 38,770 | |||||||||
| Corporate development |
64,490 | 80,338 | 72,593 | |||||||||
| Other operating |
19,116 | 14,977 | 18,785 | |||||||||
|
|
|
|
|
|
|
|||||||
| 2,226,887 | 2,235,675 | 1,549,667 | ||||||||||
| Interest on SBA obligations |
266,099 | 188,231 | 171,138 | |||||||||
| Bad debt expense (recovery) |
6,311 | (64,654 | ) | 74,795 | ||||||||
|
|
|
|
|
|
|
|||||||
| Total expenses |
2,499,297 | 2,359,252 | 1,795,600 | |||||||||
|
|
|
|
|
|
|
|||||||
| Investment gain before income taxes |
85,178 | 91,784 | 809,021 | |||||||||
| Income tax expense (benefit) |
63,343 | (62,694 | ) | 122,960 | ||||||||
|
|
|
|
|
|
|
|||||||
| Net investment gain |
21,835 | 154,478 | 686,061 | |||||||||
|
|
|
|
|
|
|
|||||||
| Net realized gain (loss) on investments: |
||||||||||||
| Affiliate investments |
(617,619 | ) | (1,063,698 | ) | — | |||||||
| Non-Control/Non-Affiliate investments |
7,855,556 | 8,097,878 | 1,334,118 | |||||||||
|
|
|
|
|
|
|
|||||||
| Realized gain on sales and dispositions, net, before income tax expense |
7,237,937 | 7,034,180 | 1,334,118 | |||||||||
| Income tax expense |
2,470,453 | 2,659,826 | 502,979 | |||||||||
|
|
|
|
|
|
|
|||||||
| Net realized gain on sales and disposition of investments |
4,767,484 | 4,374,354 | 831,139 | |||||||||
| Net (decrease) increase in unrealized appreciation on investments: |
||||||||||||
| Control investments |
5,336 | 19,178 | 2,150,486 | |||||||||
| Affiliate investments |
(270,020 | ) | 972,991 | (1,166,244 | ) | |||||||
| Non-Control/Non-Affiliate investments |
(97,160 | ) | (3,826,153 | ) | (219,694 | ) | ||||||
|
|
|
|
|
|
|
|||||||
| Change in unrealized appreciation before income tax (benefit) expense |
(361,844 | ) | (2,833,984 | ) | 764,548 | |||||||
| Deferred income tax (benefit) expense |
(114,006 | ) | (1,178,509 | ) | 341,981 | |||||||
|
|
|
|
|
|
|
|||||||
| Net (decrease) increase in unrealized appreciation on investments |
(247,838 | ) | (1,655,475 | ) | 422,567 | |||||||
|
|
|
|
|
|
|
|||||||
| Net realized and unrealized gain on investments |
4,519,646 | 2,718,879 | 1,253,706 | |||||||||
|
|
|
|
|
|
|
|||||||
| Net increase in net assets from operations |
$ | 4,541,481 | $ | 2,873,357 | $ | 1,939,767 | ||||||
|
|
|
|
|
|
|
|||||||
| Weighted average shares outstanding |
6,391,175 | 6,513,385 | 6,770,389 | |||||||||
| Basic and diluted net increase in net assets from operations per share |
$ | 0.71 | $ | 0.44 | $ | 0.29 | ||||||
See accompanying notes
29
RAND CAPITAL CORPORATION AND SUBSIDIARY
CONSOLIDATED STATEMENTS OF CHANGES IN NET ASSETS
For The Years Ended December 31, 2014, 2013 and 2012
| 2014 | 2013 | 2012 | ||||||||||
| Net assets at beginning of period |
$ | 28,069,332 | $ | 25,782,300 | $ | 24,399,121 | ||||||
| Net investment gain |
21,835 | 154,478 | 686,061 | |||||||||
| Net realized gain on sales and dispositions of investments |
4,767,484 | 4,374,354 | 831,139 | |||||||||
| Net (decrease) increase in unrealized appreciation on investments |
(247,838 | ) | (1,655,475 | ) | 422,567 | |||||||
|
|
|
|
|
|
|
|||||||
| Net increase in net assets from operations |
4,541,481 | 2,873,357 | 1,939,767 | |||||||||
| Purchase of treasury stock |
(257,372 | ) | (586,325 | ) | (556,588 | ) | ||||||
|
|
|
|
|
|
|
|||||||
| Total increase in net assets |
4,284,109 | 2,287,032 | 1,383,179 | |||||||||
|
|
|
|
|
|
|
|||||||
| Net assets at end of period |
$ | 32,353,441 | $ | 28,069,332 | $ | 25,782,300 | ||||||
|
|
|
|
|
|
|
|||||||
| Accumulated net investment (loss) |
($ | 867,482 | ) | ($ | 889,317 | ) | ($ | 1,043,795 | ) | |||
|
|
|
|
|
|
|
|||||||
See accompanying notes.
30
RAND CAPITAL CORPORATION AND SUBSIDIARY
CONSOLIDATED STATEMENTS OF CASH FLOWS
For The Years Ended December 31, 2014, 2013 and 2012
| 2014 | 2013 | 2012 | ||||||||||
| Cash flows from operating activities: |
||||||||||||
| Net increase in net assets from operations |
$ | 4,541,481 | $ | 2,873,357 | $ | 1,939,767 | ||||||
| Adjustments to reconcile net increase in net assets to net cash (used in) provided by operating activities: |
||||||||||||
| Depreciation and amortization |
28,175 | 38,758 | 64,368 | |||||||||
| Original issue discount accretion |
(15,492 | ) | (15,492 | ) | (19,028 | ) | ||||||
| Change in interest receivable allowance |
6,311 | (74,795 | ) | 74,795 | ||||||||
| Decrease (increase) in unrealized appreciation on investments |
361,844 | 2,833,984 | (764,548 | ) | ||||||||
| Deferred tax (benefit) expense |
(368,457 | ) | (739,806 | ) | 262,975 | |||||||
| Realized gain on portfolio investments, net |
(7,237,937 | ) | (7,034,180 | ) | (1,334,118 | ) | ||||||
| Non-cash conversion of debenture interest |
(211,127 | ) | (310,322 | ) | (131,825 | ) | ||||||
| Changes in operating assets and liabilities: |
||||||||||||
| (Increase) decrease in interest receivable |
(113,312 | ) | 49,727 | (23,951 | ) | |||||||
| Decrease in other assets |
795,404 | 19,882 | 1,793,247 | |||||||||
| Decrease in prepaid income taxes |
— | — | 822,789 | |||||||||
| Increase in income taxes payable |
842,368 | 1,195,732 | 27,695 | |||||||||
| Increase in profit sharing and bonus payable |
66,246 | 537,244 | 300,000 | |||||||||
| (Decrease) increase in accounts payable and accrued liabilities |
(46,450 | ) | 125,155 | 12,743 | ||||||||
| (Decrease) increase in deferred revenue |
(2,200 | ) | (7,400 | ) | 33,863 | |||||||
|
|
|
|
|
|
|
|||||||
| Total adjustments |
(5,894,627 | ) | (3,381,513 | ) | 1,119,005 | |||||||
|
|
|
|
|
|
|
|||||||
| Net cash (used in) provided by operating activities |
(1,353,146 | ) | (508,156 | ) | 3,058,772 | |||||||
| Cash flows from investing activities: |
||||||||||||
| Investments originated |
(6,091,152 | ) | (4,866,273 | ) | (5,915,158 | ) | ||||||
| Proceeds from sale of portfolio investments |
9,234,323 | 9,023,539 | 1,894,628 | |||||||||
| Proceeds from loan repayments |
968,803 | 457,559 | 422,124 | |||||||||
| Capital expenditures |
(11,299 | ) | (7,547 | ) | — | |||||||
|
|
|
|
|
|
|
|||||||
| Net cash provided by (used in) investing activities |
4,100,675 | 4,607,278 | (3,598,406 | ) | ||||||||
| Cash flows from financing activities: |
||||||||||||
| Repayment of SBA debentures |
— | (900,000 | ) | (3,100,000 | ) | |||||||
| Proceeds from SBA debentures |
1,000,000 | 3,000,000 | 4,000,000 | |||||||||
| Origination costs to SBA |
(24,250 | ) | (72,750 | ) | (97,000 | ) | ||||||
| Purchase of treasury shares |
(257,372 | ) | (586,325 | ) | (556,588 | ) | ||||||
|
|
|
|
|
|
|
|||||||
| Net cash provided by financing activities |
718,378 | 1,440,925 | 246,412 | |||||||||
|
|
|
|
|
|
|
|||||||
| Net increase (decrease) in cash |
3,465,907 | 5,540,047 | (293,222 | ) | ||||||||
|
|
|
|
|
|
|
|||||||
| Cash: |
||||||||||||
| Beginning of year |
9,764,810 | 4,224,763 | 4,517,985 | |||||||||
|
|
|
|
|
|
|
|||||||
| End of year |
$ | 13,230,717 | $ | 9,764,810 | $ | 4,224,763 | ||||||
|
|
|
|
|
|
|
|||||||
See accompanying notes.
31
RAND CAPITAL CORPORATION AND SUBSIDIARY
CONSOLIDATED SCHEDULE OF PORTFOLIO INVESTMENTS
December 31, 2014
| (a) Company, Geographic Location, Business |
Type of Investment |
(b) Date Acquired |
(c) Equity |
Cost | (d)(f) Fair Value |
Percent of Net Assets |
||||||||||||||||
| Non-Control/Non-Affiliate Investments |
||||||||||||||||||||||
| BeetNPath, LLC(e)(g) Ithaca, NY. Frozen entrées made from 100% whole grain steel cut oats. www.grainful.com |
$150,000 convertible promissory note at 6% due October 20, 2016. | 10/20/14 | — | 150,000 | 150,000 | 0.5 | % | |||||||||||||||
| Crashmob, Inc.(e)(g) Boston, MA. Mobile marketing platform for engagement, advertising and surveys. (Software) www.statisfy.co |
500,000 Series seed preferred shares. | 8/18/14 | 4 | % | 500,000 | 500,000 | 1.5 | % | ||||||||||||||
| Empire Genomics, LLC(e)(g) Buffalo, NY. Molecular diagnostics company that offers a comprehensive menu of assay services for diagnosing and guiding patient therapeutic treatments. (Health Care) www.empiregenomics.com |
$600,000 senior secured convertible term note at 10% due December 1, 2015. | 6/13/14 | — | 600,000 | 600,000 | 1.9 | % | |||||||||||||||
| Kinex Pharmaceuticals, Inc.(e)(g) Buffalo, NY. Specialty pharmaceutical and drug development. (Health Care) www.kinexpharma.com |
11,574 common shares. | 9/8/14 | <1 | % | 143,285 | 254,628 | 0.8 | % | ||||||||||||||
| Mercantile Adjustment Bureau, LLC(e)(g) Williamsville, NY. Full service accounts receivable management and collections company. (Contact Center) www.mercantilesolutions.com |
$1,099,039 subordinated secured note at 13% due October 30, 2017. $150,000 subordinated debenture at 8% due June 30, 2018. Warrant for 3.29% membership interests. Option for 1.5% membership interests. (i) Interest receivable $79,025. |
10/22/12 | 4 | % |
|
1,070,697 150,000
97,625 |
|
|
1,070,697 150,000
97,625 |
|
||||||||||||
|
|
|
|
|
|||||||||||||||||||
| Total Mercantile | 1,318,322 | 1,318,322 | 4.1 | % | ||||||||||||||||||
| OnCore Golf Technology, Inc.(e)(g) Buffalo, NY. Maker of patented hollow-metal core golf balls. (Consumer Product) www.oncoregolf.com |
80,000 Series AA preferred shares. | 12/31/14 | 4 | % | 200,000 | 200,000 | 0.6 | % | ||||||||||||||
| SocialFlow, Inc.(e)(g) New York, NY. Provides instant analysis of social networks using proprietary, predictive analytic algorithm to optimize advertising and publishing. (Software) www.socialflow.com |
1,049,538 Series B preferred shares. 1,204,819 Series B-1 preferred shares. | 4/5/13 | 4 | % | 1,250,000 | 1,250,000 | 3.9 | % | ||||||||||||||
| Somerset Gas Transmission Company, LLC Columbus, OH. Natural gas transportation. (Oil and Gas) www.somersetgas.com |
26.5337 units. | 7/10/02 | 3 | % | 719,097 | 786,748 | 2.4 | % | ||||||||||||||
| Synacor, Inc. NASDAQ: SYNC(e)(g)(n)(o) Buffalo, NY. Develops provisioning platforms for aggregation and delivery of content and services across multiple digital devices. (Software) www.synacor.com |
301,582 unrestricted common shares valued at $2.01 per share. | 11/18/02 | 1 | % | 385,680 | 606,000 | 1.9 | % | ||||||||||||||
| Other Non-Control/Non-Affiliate Investments: |
||||||||||||||||||||||
| DataView, LLC (Software) (e) |
Membership Interest | — | — | 310,357 | 0 | 0.0 | % | |||||||||||||||
| UStec/Wi3 (Software) (e) |
Common Stock | — | — | 100,500 | 0 | 0.0 | % | |||||||||||||||
|
|
|
|
|
|||||||||||||||||||
| Subtotal Non-Control/Non-Affiliate Investments |
$ | 5,677,241 | $ | 5,665,698 | ||||||||||||||||||
|
|
|
|
|
|||||||||||||||||||
32
RAND CAPITAL CORPORATION AND SUBSIDIARY
CONSOLIDATED SCHEDULE OF PORTFOLIO INVESTMENTS
December 31, 2014 (Continued)
| (a) Company, Geographic Location, Business |
Type of Investment |
(b) Date Acquired |
(c) Equity |
Cost | (d)(f) Fair Value |
Percent of Net Assets |
||||||||||||||||
| Affiliate Investments – 45.2% of net assets(k) |
||||||||||||||||||||||
| Carolina Skiff LLC(g) Waycross, GA. Manufacturer of fresh water, ocean fishing and pleasure boats. (Consumer Product) www.carolinaskiff.com |
$985,000 Class A preferred membership interest at 9.8%. $250,000 subordinated promissory note at 14% due December 31, 2016. 6.0825% Class A common membership interest. |
1/30/04 | 7 | % | $
|
985,000 125,000 15,000 |
|
$
|
985,000 125,000 600,000 |
|
||||||||||||
|
|
|
|
|
|||||||||||||||||||
| Total Carolina Skiff | 1,125,000 | 1,710,000 | 5.3 | % | ||||||||||||||||||
| Chequed.com, Inc.(e)(g) Saratoga Springs, NY. Web based predictive employee selection and reference checking. (Software) |
408,476 Series A preferred shares. $250,000 convertible promissory note at 8% due December 31, 2015 |
11/18/10 | 16 | % |
|
1,383,222 250,000 |
|
|
1,383,222 250,000 |
|
||||||||||||
|
|
|
|
|
|||||||||||||||||||
| www.chequed.com | Total Chequed.com | 1,633,222 | 1,633,222 | 5.0 | % | |||||||||||||||||
| CrowdBouncer, Inc.(e)(g) Buffalo, NY. JOBS Act compliance for broker-dealers and crowdfunding portals. (Software) www.crowdbouncer.com |
300,000 Series A preferred shares. | 1/22/14 | 15 | % | 300,000 | 0 | 0.0 | % | ||||||||||||||
| First Wave Products Group, LLC(e)(g)(p) Batavia, NY. Sells First Crush automated pill crusher that crushes and grinds medical pills for nursing homes and medical institutions. (Manufacturing) www.firstwaveproducts.com |
$500,000 senior term notes at 10% (Payment in Kind (PIK) through May 31, 2015) due December 31, 2016. $280,000 junior term notes at 10% (PIK through May 31, 2015) due December 31, 2016. Warrant for 41,619 capital securities. |
4/19/12 | 7 | % |
|
637,992 308,687 22,000 |
|
|
637,992 308,687 22,000 |
|
||||||||||||
|
|
|
|
|
|||||||||||||||||||
| Total First Wave | 968,679 | 968,679 | 3.0 | % | ||||||||||||||||||
| GiveGab, Inc. (e)(g) Ithaca, NY. Social network program that connects volunteers with nonprofit organizations. (Software) www.givegab.com |
2,254,822 Series A preferred shares. | 3/13/13 | 7 | % | 403,388 | 403,388 | 1.2 | % | ||||||||||||||
| G-TEC Natural Gas Systems (e) Buffalo, NY. Manufactures and distributes systems that allow natural gas to be used as an alternative fuel to gases. (Manufacturing) www.gas-tec.com |
18.545% Class A membership interest. 8% cumulative dividend. | 8/31/99 | 19 | % | 400,000 | 100,000 | 0.3 | % | ||||||||||||||
| Intrinsiq Materials, Inc. (e)(g) Rochester, NY. Produces printable electronics utilizing a unique process of nanomaterial based ink in a room-temperature environment. (Manufacturing) www.intrinsiqmaterials.com |
599,055 Series 2 Preferred shares. | 9/19/13 | 7 | % | 600,002 | 600,002 | 1.9 | % | ||||||||||||||
| Knoa Software, Inc. (e)(g) New York, NY. End user experience management and performance (EMP) solutions utilizing enterprise applications. (Software) www.knoa.com |
973,533 Series A-1 convertible preferred shares. 1,876,922 Series B preferred shares. (Fully diluted common share equivalent of 3,336,010). | 11/20/12 | 7 | % | 1,229,155 | 872,255 | 2.7 | % | ||||||||||||||
| KnowledgeVision Systems, Inc. (e)(g) Lincoln, MA. Online presentation and training software. (Software) www.knowledgevision.com |
200,000 Series A-1 preferred shares. 214,285 Series A-2 preferred shares. | 11/13/13 | 5 | % | 550,000 | 550,000 | 1.7 | % | ||||||||||||||
| Mezmeriz, Inc. (e)(g) Ithaca, NY. Micro-electronic mechanical systems (MEMS) developer of carbon fiber MEMS mirror modules for gesture recognition and 3D scanning. |
360,526 Series A preferred shares. $200,000 convertible notes at 8% due December 31, 2014. | 1/9/08 | 8 | % |
|
391,373 200,000 |
|
|
0 200,000 |
|
0.6 | % | ||||||||||
|
|
|
|
|
|||||||||||||||||||
| www.mezmeriz.com | Total Mezmeriz | 591,373 | 200,000 | |||||||||||||||||||
33
RAND CAPITAL CORPORATION AND SUBSIDIARY
CONSOLIDATED SCHEDULE OF PORTFOLIO INVESTMENTS
December 31, 2014 (Continued)
| (a) Company, Geographic Location, Business |
Type of Investment |
(b) Date Acquired |
(c) Equity |
Cost | (d)(f) Fair Value |
Percent of Net Assets |
||||||||||||||||
| Microcision LLC(g) Philadelphia, PA. Custom manufacturer of medical and dental implants. (Manufacturing). www.microcision.com |
$1,500,000 subordinated promissory note at 11% due January 31, 2017. 15% Class A common membership interest. |
9/24/09 | 15 | % |
|
1,891,964 — |
|
|
1,891,964 — |
|
5.8 | % | ||||||||||
| New Monarch Machine Tool, Inc.(g) Cortland, NY. Manufactures and services vertical/horizontal machining centers. (Manufacturing) www.monarchmt.com |
22.84 common shares. | 9/24/03 | 15 | % | 22,841 | 22,841 | 0.1 | % | ||||||||||||||
| Rheonix, Inc.(e)(g) Ithaca, NY. Developer of fully automated microfluidic based molecular assay and diagnostic testing. (Health Care) |
9,676 common shares. (g) 1,839,422 Series A preferred shares. (g) 50,593 common shares. |
10/29/09 | 5 | % |
|
0 2,099,999 0 |
|
|
11,000 2,165,999 59,000 |
|
6.9 | % | ||||||||||
|
|
|
|
|
|||||||||||||||||||
| www.rheonix.com |
Total Rheonix | 2,099,999 | 2,235,999 | |||||||||||||||||||
| SciAps, Inc.(e)(g) Woburn, MA. Instrumentation company specializing in portable analytical instruments utilizing LIBS and RAMAN spectroscopy to identify compounds, minerals, and elements. (Manufacturing) www.sciaps.com |
187,500 Series A preferred shares. | 7/12/13 | 9 | % | 1,500,000 | 1,500,000 | 4.6 | % | ||||||||||||||
| SOMS Technologies, LLC(e)(g) Valhalla, NY. Produces and markets the microGreen Extended Performance Oil Filter. (Consumer Products) www.microgreenfilter.com |
5,959,490 Series B membership interests. | 12/2/08 | 9 | % | 472,632 | 528,348 | 1.6 | % | ||||||||||||||
| Teleservices Solutions Holdings, LLC(g) Montvale, NJ. Customer contact center specializing in customer acquisition and retention for selected industries. |
250,000 Class B preferred units. 1,000,000 Class C preferred units. 80,000 Class D preferred units. |
5/30/14 | 9 | % |
|
250,000 1,070,680 80,000 |
|
|
250,000 1,070,680 80,000 |
|
4.3 | % | ||||||||||
|
|
|
|
|
|||||||||||||||||||
| www.ipacesetters.com |
Total Teleservices | 1,400,680 | 1,400,680 | |||||||||||||||||||
|
|
|
|
|
|||||||||||||||||||
| Subtotal Affiliate Investments |
$ | 15,188,935 | $ | 14,617,378 | ||||||||||||||||||
|
|
|
|
|
|||||||||||||||||||
| Control Investments — 31.0%(l) |
||||||||||||||||||||||
| Advantage 24/7 LLC(g) Williamsville, NY. Marketing program for wine and spirits dealers. (Marketing Company) www.advantage24-7.com |
53% Membership interest. | 12/30/10 | 53 | % | 99,500 | 99,500 | 0.3 | % | ||||||||||||||
| Gemcor II, LLC(g)(h)(m) West Seneca, NY. Designs and sells automatic riveting machines used in the assembly of aircraft. (Manufacturing) |
$1,000,000 subordinated promissory note at 15% due September 1, 2017. 31.25 membership units. |
6/28/04 | 31 | % | $
|
622,800 625,000 |
|
$
|
622,800 9,300,000 |
|
30.7 | % | ||||||||||
|
|
|
|
|
|||||||||||||||||||
| www.gemcor.com |
Total Gemcor | 1,247,800 | 9,922,800 | |||||||||||||||||||
|
|
|
|
|
|||||||||||||||||||
| Subtotal Control Investments |
$ | 1,347,300 | $ | 10,022,300 | ||||||||||||||||||
|
|
|
|
|
|||||||||||||||||||
| TOTAL INVESTMENTS — 93.7% |
$ | 22,213,476 | $ | 30,305,376 | ||||||||||||||||||
|
|
|
|||||||||||||||||||||
| LIABILITIES IN EXCESS OF OTHER ASSETS — 6.3% |
2,048,065 | |||||||||||||||||||||
|
|
|
|||||||||||||||||||||
| NET ASSETS — 100% |
$ | 32,353,441 | ||||||||||||||||||||
|
|
|
|||||||||||||||||||||
Notes to the Consolidated Schedule of Portfolio Investments
| (a) | At December 31, 2014, restricted securities represented approximately 98% of the fair value of the investment portfolio. Restricted securities are subject to one or more restrictions on resale and are not freely marketable. Freed Maxick CPAs, P.C. has not audited the business descriptions of the portfolio companies. |
| (b) | The Date Acquired column indicates the year in which the Corporation acquired its first investment in the company or a predecessor company. Freed Maxick CPAs, P.C. has not audited the date acquired of the portfolio companies. |
34
RAND CAPITAL CORPORATION AND SUBSIDIARY
CONSOLIDATED SCHEDULE OF PORTFOLIO INVESTMENTS
December 31, 2014 (Continued)
| (c) | Each equity percentage estimates the Corporation’s ownership interest in the applicable portfolio investment. The estimated ownership is calculated based on the percent of outstanding voting securities held by the Corporation or the potential percentage of voting securities held by the Corporation upon exercise of warrants or conversion of debentures, or other available data. Freed Maxick CPAs, P.C. has not audited the equity percentages of the portfolio companies. If applicable, the symbol “<1%” indicates that the Corporation holds an equity interest of less than one percent. |
| (d) | The Corporation’s investments are carried at fair value in accordance with Accounting Standards Codification (ASC) 820 “Fair Value Measurements” which defines fair value and establishes guidelines for measuring fair value. At December 31, 2014, ASC 820 designates 2% of the Corporation’s investments as “Level 1” and 98% as “Level 3” assets. Under the valuation policy of the Corporation, unrestricted publicly held securities are valued at the average closing bid price for these securities for the last three trading days of the month. Restricted securities are subject to restrictions on resale, and are valued at fair value as determined by the management of the Corporation and submitted to the Board of Directors for approval. Fair value is considered to be the amount which the Corporation may reasonably expect to receive for portfolio securities when sold on the valuation date. Valuations as of any particular date, however, are not necessarily indicative of amounts which may ultimately be realized as a result of future sales or other dispositions of securities and these favorable or unfavorable differences could be material. Among the factors considered in determining the fair value of restricted securities are the financial condition and operating results, projected operations, and other analytical data relating to the investment. Also considered are the market prices for unrestricted securities of the same class (if applicable) and other matters which may have an impact on the value of the portfolio company (see Note 2 “Investments” to the Consolidated Financial Statements). |
| (e) | These investments are non-income producing. All other investments are income producing. Non-income producing investments have not generated cash payments of interest or dividends including LLC tax-related distributions within the last twelve months, or are not expected to do so going forward. |
| (f) | As of December 31, 2014, the total cost of investment securities approximated $22.2 million. Net unrealized appreciation was approximately $8.1 million, which was comprised of $9.9 million of unrealized appreciation of investment securities and ($1.8) million related to unrealized depreciation of investment securities. At December 31, 2014 the aggregate gross unrealized gain for federal income tax purposes was $6.1 million and the aggregate gross unrealized loss for federal income tax purposes was ($1.5) million. The net unrealized gain was $4.6 million based on a tax cost of $25.8 million. |
| (g) | Rand Capital SBIC, Inc. investment. |
| (h) | Reduction in cost and value from previously reported balances reflects current principal repayment. |
| (i) | Represents interest due (amounts over $50,000 net of reserves) from investment included as interest receivable on the Corporation’s Statement of Financial Position. |
| (j) | Non-Control/Non-Affiliate investments are investments that are neither Control Investments nor Affiliate Investments. |
| (k) | Affiliate investments are defined by the Investment Company Act of 1940, as amended (“1940 Act”), as those Non-Control investments in companies in which between 5% and 25% of the voting securities are owned. |
| (l) | Control investments are defined by the 1940 Act as investments in companies in which more than 25% of the voting securities are owned or where greater than 50% of the board representation is maintained. |
| (m) | Gemcor II, LLC is an “unconsolidated significant subsidiary” as defined in SEC’s Regulation S-X. |
| (n) | Publicly owned company. |
| (o) | On December 31, 2014, the Corporation’s shares of Synacor were valued at $2.01 per share in accordance with the Corporation’s valuation policy for unrestricted publicly held securities (Level 1). See Synacor’s publicly disclosed financial reports at sec.gov for additional information on Synacor’s industry, financial results and business operations. |
| (p) | Payment in kind represents earned interest that is added to the cost basis of the investment. |
35
RAND CAPITAL CORPORATION AND SUBSIDIARY
CONSOLIDATED SCHEDULE OF PORTFOLIO INVESTMENTS
December 31, 2014 (Continued)
Investments in and Advances to Affiliates
| Company |
Type of Investment |
December 31, 2013 Fair Value |
Gross Additions (1) |
Gross Reductions (2) |
December 31, 2014 Fair Value |
Amount of Interest/ Dividend/ Fee Income(3) |
||||||||||||||||
| Control Investments: |
||||||||||||||||||||||
| Advantage 24/7 LLC |
53% Membership interest | $ | 99,500 | $ | — | $ | — | $ | 99,500 | $ | 41,695 | |||||||||||
| Gemcor II, LLC |
$500,000 subordinated promissory note at 15% $1,000,000 subordinated promissory note at 15% 31.25 membership units. |
|
110,194 800,125 9,300,000 |
|
|
— — — |
|
|
(110,194 (177,325 — |
) )
|
|
0 622,800 9,300,000 |
|
|
6,279 105,939 1,516,822 |
| ||||||
|
|
|
|
|
|
|
|
|
|||||||||||||||
| Total Gemcor | 10,210,319 | (287,519 | ) | 9,922,800 | 1,629,040 | |||||||||||||||||
|
|
|
|
|
|
|
|
|
|||||||||||||||
| NDT Acquisitions |
Common Stock | — | 5,336 | (5,336 | ) | — | 2,668 | |||||||||||||||
|
|
|
|
|
|
|
|
|
|
|
|||||||||||||
| Total Control Investments | $ | 10,309,819 | $ | 5,336 | (292,855 | ) | $ | 10,022,300 | $ | 1,673,403 | ||||||||||||
|
|
|
|
|
|
|
|
|
|
|
|||||||||||||
| Affiliate Investments: |
||||||||||||||||||||||
| Carolina Skiff LLC |
$985,000 Class A preferred membership interest at 9.8%. $250,000 subordinated promissory note at 14% 6.0825% Class A common membership interest. |
$
|
985,000 250,000 600,000 |
|
$
|
— — — |
|
$
|
— (125,000 |
) |
$
|
985,000 125,000 600,000 |
|
$
|
96,530 29,701 54,089 |
| ||||||
|
|
|
|
|
|
|
|
|
|
|
|||||||||||||
| Total Carolina Skiff | 1,835,000 | — | (125,000 | ) | 1,710,000 | 180,320 | ||||||||||||||||
|
|
|
|
|
|
|
|
|
|
|
|||||||||||||
| Chequed.com, Inc. |
408,476 Series A preferred shares. $250,000 convertible promissory note at 8% |
|
1,033,222 — |
|
|
350,000 250,000 |
|
|
— — |
|
|
1,383,222 250,000 |
|
|
— 767 |
| ||||||
|
|
|
|
|
|
|
|
|
|||||||||||||||
| Total Chequed | 1,033,222 | 600,000 | 1,633,222 | 767 | ||||||||||||||||||
|
|
|
|
|
|
|
|
|
|||||||||||||||
| CrowdBouncer, Inc. |
270,000 Series A preferred shares. | — | 300,000 | (300,000 | ) | 0 | — | |||||||||||||||
| First Wave Products Group, LLC |
$500,000 senior term notes at 10% $280,000 junior term notes at 10% Warrant for 41,619 capital securities. |
|
571,301 204,533 22,000 |
|
|
66,691 104,154 — |
|
|
— — — |
|
|
637,992 308,687 22,000 |
|
|
68,524 24,154 — |
| ||||||
|
|
|
|
|
|
|
|
|
|
|
|||||||||||||
| Total First Wave | 797,834 | 170,845 | — | 968,679 | 92,678 | |||||||||||||||||
|
|
|
|
|
|
|
|
|
|
|
|||||||||||||
| GiveGab, Inc. |
2,254,822 Series A preferred shares. | 250,000 | 153,388 | — | 403,388 | — | ||||||||||||||||
| G-TEC Natural Gas Systems |
18.545% Class A membership interest. 8% cumulative dividend. |
|
100,000 |
|
|
— |
|
|
— |
|
|
100,000 |
|
|
— |
| ||||||
| Intrinsiq Materials, Inc. |
599,055 Series 2 Preferred shares. | 600,002 | — | — | 600,002 | — | ||||||||||||||||
| Knoa Software, Inc. |
973,533 Series A-1 convertible preferred shares. 1,876,922 Series B preferred shares. (Fully diluted common share equivalent of 3,336,010). | 750,000 | 479,155 | (356,900 | ) | 872,255 | 1,391 | |||||||||||||||
| KnowledgeVision Systems, Inc. |
200,000 Series A-1 preferred shares 214,285 Series A-2 preferred shares |
|
250,000 — |
|
|
— 300,000 |
|
|
— — |
|
|
250,000 300,000 |
|
— | ||||||||
|
|
|
|
|
|
|
|||||||||||||||||
| Total Knowledge Vision | 250,000 | 300,000 | 550,000 | |||||||||||||||||||
|
|
|
|
|
|
|
|||||||||||||||||
| Mezmeriz, Inc. |
360,526 Series A preferred shares. Convertible notes at 8% due December 31, 2014. |
|
391,373 200,000 |
|
|
— — |
|
|
(391,373 — |
)
|
|
0 200,000 |
|
|
— — |
| ||||||
|
|
|
|
|
|
|
|||||||||||||||||
| Total Mezmeriz | 591,373 | (391,373 | ) | 200,000 | ||||||||||||||||||
|
|
|
|
|
|
|
|||||||||||||||||
| Microcision LLC |
$1,500,000 subordinated promissory note at 11% due January 31, 2017. Class A common membership interest. |
|
1,891,965 — |
|
|
— |
|
|
(1 |
) |
|
1,891,964 — |
|
|
208,116 — |
| ||||||
| New Monarch Machine Tool, Inc. |
22.84 common shares. | 22,841 | — | — | 22,841 | 47,682 | ||||||||||||||||
| QuaDPharma, LLC |
$556,285.22 second note allonge at 10% 141.75 Class A units of membership interest. |
|
556,285 350,000 |
|
— |
|
(556,285 (350,000 |
) ) |
|
— — |
|
59,332 | ||||||||||
|
|
|
|
|
|||||||||||||||||||
| Total QuaDPharma | 906,285 | (906,285 | ) | — | ||||||||||||||||||
|
|
|
|
|
|||||||||||||||||||
36
RAND CAPITAL CORPORATION AND SUBSIDIARY
CONSOLIDATED SCHEDULE OF PORTFOLIO INVESTMENTS
December 31, 2014 (Continued)
| Company |
Type of Investment |
December 31, 2013 Fair Value |
Gross Additions (1) |
Gross Reductions (2) |
December 31, 2014 Fair Value |
Amount of Interest/ Dividend/ Fee Income(3) |
||||||||||||||||
| Rheonix, Inc. |
9,676 common shares. 1,839,422 Series A preferred shares. 50,593 common shares. |
|
11,000 2,165,999 59,000 |
|
|
— — — |
|
|
— — — |
|
|
11,000 2,165,999 59,000 |
|
|
— — — |
| ||||||
|
|
|
|
|
|||||||||||||||||||
| Total Rheonix | 2,235,999 | 2,235,999 | ||||||||||||||||||||
|
|
|
|
|
|||||||||||||||||||
| SciAps, Inc. |
187,500 Series A preferred shares. | 1,000,000 | 500,000 | — | 1,500,000 | — | ||||||||||||||||
| SOMS Technologies, LLC |
5,959,490 Series B membership interests. | 528,348 | — | — | 528,348 | — | ||||||||||||||||
| Teleservices Solutions Holdings, LLC |
250,000 Class B shares. 1,000,000 Class C shares 80,000 Class D preferred units |
|
— — — |
|
|
250,000 1,070,680 80,000 |
|
— |
|
250,000 1,070,680 80,000 |
|
|
— 98,952 — |
| ||||||||
|
|
|
|
|
|
|
|||||||||||||||||
| Total Teleservices | 1,400,680 | 1,400,680 | 98,952 | |||||||||||||||||||
|
|
|
|
|
|
|
|
|
|
|
|||||||||||||
| Total Affiliate Investments | $ | 12,792,869 | 3,904,068 | (2,079,559 | ) | $ | 14,617,378 | $ | 689,238 | |||||||||||||
|
|
|
|
|
|
|
|
|
|
|
|||||||||||||
| Total Control and Affiliate Investments | $ | 23,102,688 | $ | 3,909,404 | ($ | 2,372,414 | ) | $ | 24,639,678 | $ | 2,362,641 | |||||||||||
|
|
|
|
|
|
|
|
|
|
|
|||||||||||||
This schedule should be read in conjunction with the Corporation’s Consolidated Financial Statements, including the Consolidated Schedule of Portfolio Investments and Notes to the Consolidated Financial Statements.
| (1) | Gross additions include increases in the cost basis of investments resulting from new portfolio investment, follow on investments, capitalized interest and the accretion of discounts. Gross Additions also include net increases in unrealized appreciation or net decreases in unrealized depreciation. |
| (2) | Gross reductions include decreases in the cost basis of investments resulting from principal repayments, sales, net increases in unrealized depreciation and net decreases in unrealized appreciation. |
| (3) | Represents the total amount of interest, fees or dividends credited to income for the portion of the period an investment was included in Control or Affiliate categories, respectively. |
37
RAND CAPITAL CORPORATION AND SUBSIDIARY
CONSOLIDATED SCHEDULE OF PORTFOLIO INVESTMENTS
December 31, 2014 (Continued)
(Unaudited)
| Industry Classification |
Percentage of Total Investments (at fair value) as of December 31, 2014 |
|||
| Manufacturing |
49.5 | % | ||
| Software |
19.2 | % | ||
| Healthcare |
10.2 | % | ||
| Contact Center |
9.0 | % | ||
| Consumer Product |
8.5 | % | ||
| Oil and Gas |
2.6 | % | ||
| Electronics |
0.7 | % | ||
| Marketing |
0.3 | % | ||
|
|
|
|||
| Total Investments |
100 | % | ||
|
|
|
|||
38
RAND CAPITAL CORPORATION AND SUBSIDIARY
CONSOLIDATED SCHEDULE OF PORTFOLIO INVESTMENTS
December 31, 2013
| (a) Company, Geographic Location, Business Description, (Industry) and Website |
Type of Investment |
(b) Date Acquired |
(c) Equity |
Cost | (d)(f) Fair Value |
Percent of Net Assets |
||||||||||||||||
| Non-Control/Non-Affiliate Investments — 19.6% of net assets (j) |
||||||||||||||||||||||
| BinOptics Corporation (e)(g) Ithaca, NY. Design and manufacture of semiconductor FP and DFB lasers. (Electronics Developer) www.binoptics.com |
20,891,357 Series 2 convertible preferred shares. |
11/8/11 | 4 | % | $ | 1,799,999 | $ | 1,799,999 | 6.4 | % | ||||||||||||
| KnowledgeVision Systems, Inc. (e)(g) Lincoln, MA. Online presentation software. (Software) www.knowledgevision.com |
200,000 Series A-1 preferred shares. | 11/13/13 | 3 | % | 250,000 | 250,000 | 0.9 | % | ||||||||||||||
| Mercantile Adjustment Bureau, LLC(g) Williamsville, NY. Full service accounts receivable management and collections company. (Contact Center) |
$1,075,000 subordinated secured note at 13% due October 30, 2017. Warrant for 2.47% membership interests. |
10/22/12 | 2 | % |
|
1,054,618 50,000 |
|
|
1,054,618 50,000 |
|
||||||||||||
|
|
|
|
|
|||||||||||||||||||
| www.mercantilesolutions.com |
Total Mercantile | 1,104,618 | 1,104,618 | 3.9 | % | |||||||||||||||||
| SocialFlow, Inc.(e)(g) New York, NY. Provides instant analysis of current opportunities on social networks using proprietary, predictive analytic algorithm to determine best time for its customers to publish or advertise. (Software) www.socialflow.com |
1,049,538 Series B preferred shares. | 4/5/13 | 2 | % | 500,000 | 500,000 | 1.8 | % | ||||||||||||||
| Somerset Gas Transmission Company, LLC Columbus, OH. Natural gas transportation. (Oil and Gas) www.somersetgas.com |
26.5337 units. | 7/10/02 | 3 | % | 719,097 | 786,748 | 2.8 | % | ||||||||||||||
| Synacor, Inc. NASDAQ: SYNC(e)(g)(n)(o) Buffalo, NY. Develops provisioning platforms for aggregation and delivery of content and services across multiple digital devices. (Software) www.synacor.com |
428,643 unrestricted common shares valued at $2.46 per share. | 11/18/02 | 2 | % | 625,677 | 1,054,500 | 3.8 | % | ||||||||||||||
| Other Non-Control/Non-Affiliate Investments:(e) |
||||||||||||||||||||||
| DataView, LLC (Software)(e) |
Membership Interest | — | — | 310,357 | 0 | 0.0 | % | |||||||||||||||
| UStec/Wi3 (Software)(e) |
Common Stock | — | — | 100,500 | 0 | 0.0 | % | |||||||||||||||
|
|
|
|
|
|||||||||||||||||||
| Subtotal Non-Control/Non-Affiliate Investments |
$ |
5,410,248 |
|
$ |
5,495,865 |
|
||||||||||||||||
|
|
|
|
|
|||||||||||||||||||
| Affiliate Investments — 44.7% of net assets(k) |
||||||||||||||||||||||
| Carolina Skiff LLC(g) Waycross, GA. Manufacturer of fresh water, ocean fishing and pleasure boats. (Manufacturing) www.carolinaskiff.com |
$985,000 Class A preferred 6.0825% Class A common membership interest. |
1/30/04 | 7 | % | $
|
985,000 250,000 15,000 |
|
$
|
985,000 250,000 600,000 |
|
||||||||||||
|
|
|
|
|
|||||||||||||||||||
| Total Carolina Skiff | 1,250,000 | 1,835,000 | 6.5 | % | ||||||||||||||||||
| Chequed.com, Inc.(e)(g) Saratoga Springs, NY. Predictive employee selection and development software. (Software) www.chequed.com |
305,118 Series A preferred shares. | 11/18/10 | 12 | % | 1,033,222 | 1,033,222 | 3.7 | % | ||||||||||||||
39
RAND CAPITAL CORPORATION AND SUBSIDIARY
CONSOLIDATED SCHEDULE OF PORTFOLIO INVESTMENTS
December 31, 2013 (Continued)
| (a) Company, Geographic Location, Business Description, (Industry) and Website |
Type of Investment |
(b) Date Acquired |
(c) Equity |
Cost | (d)(f) Fair Value |
Percent of Net Assets |
||||||||||||||||
| EmergingMed.com, Inc. (Software) |
Senior subordinated debt. | — | — | 778,253 | 0 | 0.0 | % | |||||||||||||||
| First Wave Products Group, LLC(e)(g)(p) Batavia, NY. Develops medical devices including First Crush, a dual action pill crusher that crushes and grinds medical pills. (Manufacturing) |
$500,000 senior term notes at 10% Payment in Kind (PIK) due December 31, 2016. $200,000 junior term note at 10% PIK due December 31, 2016. Warrant for 34,228 capital securities. |
4/19/12 | 5 | % |
|
571,301 204,533 22,000 |
|
|
571,301 204,533 22,000 |
|
||||||||||||
|
|
|
|
|
|||||||||||||||||||
| www.firstwaveproducts.com |
Total First Wave | 797,834 | 797,834 | 2.8 | % | |||||||||||||||||
| GiveGab, Inc.(e)(g) Ithaca, NY. Social network program that connects volunteers with nonprofit organizations. (Software) www.givegab.com |
1,397,428 Series A preferred shares. | 3/13/13 | 6 | % | 250,000 | 250,000 | 0.9 | % | ||||||||||||||
| G-TEC Natural Gas Systems(e) Buffalo, NY. Manufactures and distributes systems that allow natural gas to be used as an alternative fuel to gases. (Manufacturing) www.gas-tec.com |
19.081% Class A membership interest. 8% cumulative dividend. | 8/31/99 | 19 | % | 400,000 | 100,000 | 0.4 | % | ||||||||||||||
| Intrinsiq Materials, Inc.(e)(g) Rochester, NY. Produces a variety of printable electronics utilizing a unique process of making nanomaterial based ink used in a room-temperature manufacturing environment. (Manufacturing) www.intrinsiqmaterials.com |
599,055 Series 2 Preferred shares. | 9/19/13 | 7 | % | 600,002 | 600,002 | 2.1 | % | ||||||||||||||
| Knoa Software, Inc.(e)(g) New York, NY. End user experience management and performance (EMP) solutions utilizing enterprise applications. (Software) www.knoa.com |
973,533 Series A-1 convertible preferred shares. | 11/20/12 | 6 | % | 750,000 | 750,000 | 2.7 | % | ||||||||||||||
| Mezmeriz, Inc.(e)(g) Ithaca, NY. Micro-electronic mechanical systems (MEMS) developer of carbon fiber MEMS mirror modules to be embedded into mobile electronics for gesture recognition and 3D scanning. (Electronics Developer) |
360,526 Series A preferred shares. $200,000 convertible notes at 8% due December 31, 2014. | 1/9/08 | 8 | % |
|
391,373 200,000 |
|
|
391,373 200,000 |
|
||||||||||||
|
|
|
|
|
|||||||||||||||||||
| www.mezmeriz.com |
Total Mezmeriz | 591,373 | 591,373 | 2.1 | % | |||||||||||||||||
| Microcision LLC(g) Philadelphia, PA. Custom manufacturer of medical and dental implants. (Manufacturing). www.microcision.com |
$1,500,000 subordinated promissory note at 5%, 6% deferred interest due January 31, 2014. 15% Class A common membership interest. |
9/24/09 | 15 | % |
|
1,891,965 — |
|
|
1,891,965 — |
|
6.7 | % | ||||||||||
| New Monarch Machine Tool, Inc.(g) Cortland, NY. Manufactures and services vertical/horizontal machining centers. (Manufacturing) www.monarchmt.com |
22.84 common shares. | 9/24/03 | 15 | % | 22,841 | 22,841 | 0.1 | % | ||||||||||||||
| QuaDPharma, LLC(g)(h) Clarence, NY. Small scale pre-commercial and commercial manufacturing for the Pharmaceutical industry. (Manufacturing) |
$556,285.22 second note allonge at 10% due November 1, 2017. 141.75 Class A units of membership |
6/26/12 | 14 | % |
|
556,285 350,000 |
|
|
556,285 350,000 |
|
||||||||||||
|
|
|
|
|
|||||||||||||||||||
| www.quadpharmainc.com |
Total QuaDPharma | 906,285 | 906,285 | 3.2 | % | |||||||||||||||||
| Rheonix, Inc.(e)(g) Ithaca, NY. Developer of microfluidic testing devices including channels, pumps, reaction vessels, & diagnostic chambers, for testing of small volumes of chemicals and biological fluids. (Manufacturing) |
9,676 common shares. (g) 1,839,422 Series A preferred shares. (g) 50,593 common shares. |
10/29/09 | 5 | % |
|
0 2,099,999 0 |
|
|
11,000 2,165,999 59,000 |
|
||||||||||||
|
|
|
|
|
|||||||||||||||||||
| www.rheonix.com |
Total Rheonix | 2,099,999 | 2,235,999 | 8.0 | % | |||||||||||||||||
40
RAND CAPITAL CORPORATION AND SUBSIDIARY
CONSOLIDATED SCHEDULE OF PORTFOLIO INVESTMENTS
December 31, 2013 (Continued)
| (a) Company, Geographic Location, Business Description, (Industry) and Website |
Type of Investment |
(b) Date Acquired |
(c) Equity |
Cost | (d)(f) Fair Value |
Percent of Net Assets |
||||||||||||||||
| SciAps, Inc.(e)(g) Woburn, MA. Instrumentation company specializing in portable analytical instruments. Provides durable, field-tested, portable instruments to identify any compound, any mineral, and any element, anyplace on the planet. (Manufacturing) www.sciaps.com |
125,000 Series A preferred shares. | 7/12/13 | 6 | % | 1,000,000 | 1,000,000 | 3.6 | % | ||||||||||||||
| SOMS Technologies, LLC(e)(g) Valhalla, NY. Produces and markets the microGreen Extended Performance Oil Filter. (Auto Parts Developer) www.microgreenfilter.com |
5,959,490 Series B membership interests. | 12/2/08 | 9 | % | 472,632 | 528,348 | 1.9 | % | ||||||||||||||
|
|
|
|
|
|||||||||||||||||||
| Subtotal Affiliate Investments |
$ | 12,844,406 | $ | 12,542,869 | ||||||||||||||||||
|
|
|
|
|
|||||||||||||||||||
| Control Investments — 36.7% of net assets (l) |
||||||||||||||||||||||
| Advantage 24/7 LLC(g) Williamsville, NY. Marketing program for wine and spirits dealers. (Marketing Company) www.advantage24-7.com |
35% Membership interest. | 12/30/10 | 35 | % | 99,500 | 99,500 | 0.4 | % | ||||||||||||||
| Gemcor II, LLC(g)(h)(m) West Seneca, NY. Designs and sells automatic riveting machines used in the assembly of aircraft components. (Manufacturing) |
$500,000 subordinated promissory note at 15% due November 1, 2014. $1,000,000 subordinated promissory note at 15% due September 1, 2017. 31.25 membership units. | 6/28/04 | 31 | % | $
|
110,194 800,125 625,000 |
|
$
|
110,194 800,125 9,300,000 |
|
||||||||||||
|
|
|
|
|
|||||||||||||||||||
| www.gemcor.com |
Total Gemcor | 1,535,319 | 10,210,319 | 36.4 | % | |||||||||||||||||
| NDT Acquisitions, LLC (Manufacturing) |
Common stock | 5,337 | 0 | 0.0 | % | |||||||||||||||||
|
|
|
|
|
|||||||||||||||||||
| Subtotal Control Investments |
$ | 1,640,156 | $ | 10,309,819 | ||||||||||||||||||
|
|
|
|
|
|||||||||||||||||||
| TOTAL INVESTMENTS — 101.0% |
$ | 19,894,810 | $ | 28,348,553 | ||||||||||||||||||
|
|
|
|||||||||||||||||||||
| OTHER ASSETS IN EXCESS OF LIABILITIES — (1.0%) |
(279,221 | ) | ||||||||||||||||||||
|
|
|
|||||||||||||||||||||
| NET ASSETS — 100% |
$ | 28,069,332 | ||||||||||||||||||||
|
|
|
|||||||||||||||||||||
Notes to the Consolidated Schedule of Portfolio Investments
| (a) | At December 31, 2013, restricted securities represented approximately 96% of the fair value of the investment portfolio. Restricted securities are subject to one or more restrictions on resale and are not freely marketable. Freed Maxick CPAs, P.C. has not audited the business descriptions of the portfolio companies (b) The Date Acquired column indicates the year in which the Corporation acquired its first investment in the company or a predecessor company. Freed Maxick CPAs, P.C. has not audited the date acquired of the portfolio companies. |
| (c) | Each equity percentage estimates the Corporation’s ownership interest in the applicable portfolio investment. The estimated ownership is calculated based on the percent of outstanding voting securities held by the Corporation or the potential percentage of voting securities held by the Corporation upon exercise of warrants or conversion of debentures, or other available data. Freed Maxick CPAs, P.C. has not audited the equity percentages of the portfolio companies. The symbol “<1%” indicates that the Corporation holds an equity interest of less than one percent. As of December 31, 2013, the Corporation held no equity interests of less than one percent. |
41
RAND CAPITAL CORPORATION AND SUBSIDIARY
CONSOLIDATED SCHEDULE OF PORTFOLIO INVESTMENTS
December 31, 2013 (Continued)
| (d) | The Corporation’s investments are carried at fair value in accordance with Accounting Standards Codification (ASC) 820 “Fair Value Measurements” which defines fair value and establishes guidelines for measuring fair value. At December 31, 2013, ASC 820 designates 4% of the Corporation’s investments as “Level 1” and 96% as “Level 3” assets. Under the valuation policy of the Corporation, unrestricted publicly held securities are valued at the average closing bid price for these securities for the last three trading days of the month. Restricted securities are subject to restrictions on resale, and are valued at fair value as determined by the management of the Corporation and submitted to the Board of Directors for approval. Fair value is considered to be the amount which the Corporation may reasonably expect to receive for portfolio securities when sold on the valuation date. Valuations as of any particular date, however, are not necessarily indicative of amounts which may ultimately be realized as a result of future sales or other dispositions of securities and these favorable or unfavorable differences could be material. Among the factors considered in determining the fair value of restricted securities are the financial condition and operating results, projected operations, and other analytical data relating to the investment. Also considered are the market prices for unrestricted securities of the same class (if applicable) and other matters which may have an impact on the value of the portfolio company (also see Note 2 “Investments” to the consolidated financial statements). |
| (e) | These investments are non-income producing. All other investments are income producing. Non-income producing investments have not generated cash payments of interest or dividends including LLC tax-related distributions within the last twelve months, or are not expected to do so going forward. |
| (f) | As of December 31, 2013, the total cost of investment securities approximated $19.9 million. Net unrealized appreciation was approximately $8.5 million, which was comprised of $9.9 million of unrealized appreciation of investment securities and ($1.49) million related to unrealized depreciation of investment securities. At December 31, 2013 the aggregate gross unrealized gain for federal income tax purposes was $6.4 million and the aggregate gross unrealized loss for federal income tax purposes was ($1.3) million. The net unrealized gain was $5.1 million based on a tax cost of $23.2 million. |
| (g) | Rand Capital SBIC, Inc. investment. |
| (h) | Reduction in cost and value from previously reported balances reflects current principal repayment. |
| (i) | Represents interest due (amounts over $50,000 net of reserves) from investment included as interest receivable on the Corporation’s Statement of Financial Position. As of December 31, 2013 there were no interest receivable amounts exceeding $50,000. |
| (j) | Non-Control/Non-Affiliate investments are investments that are neither Control Investments nor Affiliate Investments. |
| (k) | Affiliate investments are defined by the Investment Company Act of 1940, as amended (“1940 Act”), as those Non-Control investments in companies in which between 5% and 25% of the voting securities are owned. |
| (l) | Control investments are defined by the 1940 Act as investments in companies in which more than 25% of the voting securities are owned or where greater than 50% of the board representation is maintained. |
| (m) | Gemcor II, LLC is an “unconsolidated significant subsidiary” as defined in SEC’s Regulation S-X. |
| (n) | Publicly owned company. |
| (o) | On December 31, 2013, the Corporation’s shares of Synacor were valued at $2.46 per share in accordance with the Corporation’s valuation policy for unrestricted publicly held securities (Level 1). See Synacor’s publicly disclosed financial reports at sec.gov for additional information on Synacor’s industry, financial results and business operations. |
| (p) | Payment in kind represents earned interest that is added to the cost basis of the investment. |
42
RAND CAPITAL CORPORATION AND SUBSIDIARY
CONSOLIDATED SCHEDULE OF PORTFOLIO INVESTMENTS
December 31, 2013 (Continued)
Investments in and Advances to Affiliates
| Company |
Type of Investment |
December 31, 2012 Fair Value |
Gross Additions (1) |
Gross Reductions (2) |
December 31, 2013 Fair Value |
Amount
of Interest/ Dividend/ Fee Income (3) |
||||||||||||||||
| Control Investments: |
||||||||||||||||||||||
| Advantage 24/7 LLC |
53% Membership interest | $ | 99,500 | $ | — | $ | — | $ | 99,500 | $ | 6,000 | |||||||||||
| Gemcor II, LLC |
$500,000 subordinated promissory note at 15% $1,000,000 subordinated promissory note at 15% 31.25 membership units. |
|
217,661 954,156 9,300,000 |
|
|
— — — |
|
|
(107,467 (154,031 — |
) )
|
|
110,194 800,125 9,300,000 |
|
|
24,756 131,205 1,488,409 |
| ||||||
|
|
|
|
|
|
|
|
|
|||||||||||||||
| Total Gemcor |
10,471,817 | (261,498 | ) | 10,210,319 | 1,644,370 | |||||||||||||||||
|
|
|
|
|
|
|
|
|
|||||||||||||||
| NDT Acquisitions |
Common Stock | — | 19,178 | (19,178 | ) | — | 527 | |||||||||||||||
|
|
|
|
|
|
|
|
|
|
|
|||||||||||||
| Total Control Investments |
$ | 10,571,317 | $ | 19,178 | (280,676 | ) | $ | 10,309,819 | $ | 1,650,897 | ||||||||||||
|
|
|
|
|
|
|
|
|
|
|
|||||||||||||
| Affiliate Investments: |
||||||||||||||||||||||
| Carolina Skiff LLC |
$985,000 Class A preferred membership interest at 9.8%. $250,000 subordinated promissory note at 14% 6.0825% Class A common membership interest. |
$
|
985,000 250,000 250,000 |
|
$
|
— — 350,000 |
|
$
|
— — — |
|
$
|
985,000 250,000 600,000 |
|
$
|
96,530 35,000 56,239 |
| ||||||
|
|
|
|
|
|
|
|
|
|
|
|||||||||||||
| Total Carolina Skiff |
1,485,000 | 350,000 | — | 1,835,000 | 187,769 | |||||||||||||||||
|
|
|
|
|
|
|
|
|
|
|
|||||||||||||
| Chequed.com, Inc. |
408,476 Series A preferred shares. $250,000 convertible promissory note at 8% |
533,222 | 500,000 | — | 1,033,222 | — | ||||||||||||||||
| EmergingMed |
$778,253 senior subordinated note at 8%. 1,955,967 common equity shares. |
337,500 | 103,207 | (440,707 | ) | — | 38,553 | |||||||||||||||
| First Wave Products Group, LLC |
$500,000 senior term notes at 10% $280,000 junior term notes at 10% Warrant for 41,619 capital securities. |
|
510,428 — 22,000 |
|
|
60,873 204,533 — |
|
|
— — — |
|
|
571,301 204,533 22,000 |
|
|
66,406 — — |
| ||||||
|
|
|
|
|
|
|
|
|
|||||||||||||||
| Total First Wave |
532,428 | 265,406 | 743,834 | 66,406 | ||||||||||||||||||
|
|
|
|
|
|
|
|
|
|||||||||||||||
| GiveGab, Inc. |
1,397,428 Series A preferred shares. | — | 250,000 | — | 250,000 | — | ||||||||||||||||
| G-TEC Natural Gas Systems |
19.081% Class A membership interest. 8% cumulative dividend. | 100,000 | — | — | 100,000 | — | ||||||||||||||||
| Intrinsiq Materials, Inc. |
599,055 Series 2 Preferred shares. | — | 600,002 | — | 600,002 | — | ||||||||||||||||
| Knoa Software, Inc. |
973,533 Series A-1 convertible preferred shares. 1,876,922 Series B preferred shares. (Fully diluted common share equivalent of 3,336,010). | 750,000 | — | — | 750,000 | — | ||||||||||||||||
| Mezmeriz, Inc. |
360,526 Series A preferred shares. Convertible notes at 8% due December 31, 2014. |
— |
|
391,373 200,000 |
|
|
— |
|
|
391,373 200,000 |
|
|
— |
| ||||||||
|
|
|
|
|
|
|
|||||||||||||||||
| Total Mezmeriz |
591,373 | 591,373 | 11,597 | |||||||||||||||||||
|
|
|
|
|
|
|
|||||||||||||||||
| Microcision LLC |
$1,500,000 subordinated promissory note at 5%, 6% deferred interest due January 31, 2014. 15% Class A common membership interest. |
|
1,782,579 — |
|
109,386 |
|
1,891,965 — |
|
|
200,540 — |
| |||||||||||
| Mid America Brick |
$150,000 note at 12% | — | 150,000 | (150,000 | ) | — | 3,200 | |||||||||||||||
| New Monarch Machine Tool, Inc. |
22.84 common shares. | 22,841 | — | — | 22,841 | 70,522 | ||||||||||||||||
| QuaDPharma, LLC |
$556,285.22 second note 141.75 Class A units of membership interest. |
|
333,169 350,000 |
|
|
250,000 — |
|
|
(26,884 — |
)
|
|
556,285 350,000 |
|
|
41,913 — |
| ||||||
|
|
|
|
|
|
|
|
|
|
|
|||||||||||||
| Total QuaDPharma |
683,169 | 250,000 | (26,884 | ) | 906,285 | 41,913 | ||||||||||||||||
|
|
|
|
|
|
|
|||||||||||||||||
43
RAND CAPITAL CORPORATION AND SUBSIDIARY
CONSOLIDATED SCHEDULE OF PORTFOLIO INVESTMENTS
December 31, 2013 (Continued)
| Company |
Type of Investment |
December 31, 2012 Fair Value |
Gross Additions (1) |
Gross Reductions (2) |
December 31, 2013 Fair Value |
Amount
of Interest/ Dividend/ Fee Income (3) |
||||||||||||||||
| Rheonix, Inc. |
9,676 common shares. 1,839,422 Series A preferred shares. 50,593 common shares. |
|
11,000 1,274,728 59,000 |
|
|
— 891,271 — |
|
|
— — — |
|
|
11,000 2,165,999 59,000 |
|
|
— — — |
| ||||||
|
|
|
|
|
|
|
|||||||||||||||||
| Total Rheonix |
1,344,728 | 891,271 | 2,235,999 | |||||||||||||||||||
|
|
|
|
|
|
|
|||||||||||||||||
| SciAps, Inc. |
187,500 Series A preferred shares. | — | 1,000,000 | — | 1,000,000 | — | ||||||||||||||||
| SOMS Technologies, LLC |
5,959,490 Series B membership interests. | 528,348 | — | — | 528,348 | — | ||||||||||||||||
|
|
|
|
|
|
|
|
|
|
|
|||||||||||||
| Total Affiliate Investments | $ | 8,099,815 | $ | 5,060,645 | ($ | 617,591 | ) | $ | 12,542,869 | $ | 620,500 | |||||||||||
|
|
|
|
|
|
|
|
|
|
|
|||||||||||||
| Total Control and Affiliate Investments | $ | 18,671,132 | $ | 5,079,823 | ($ | 898,267 | ) | $ | 22,852,688 | $ | 2,271,397 | |||||||||||
|
|
|
|
|
|
|
|
|
|
|
|||||||||||||
This schedule should be read in conjunction with the Corporation’s Consolidated Financial Statements, including the Consolidated Schedule of Portfolio Investments and Notes to the Consolidated Financial Statements.
| (1) | Gross additions include increases in the cost basis of investments resulting from new portfolio investment, follow on investments, capitalized interest and the accretion of discounts. Gross Additions also include net increases in unrealized appreciation or net decreases in unrealized depreciation. |
| (2) | Gross reductions include decreases in the cost basis of investments resulting from principal repayments, sales, net increases in unrealized depreciation and net decreases in unrealized appreciation. |
| (3) | Represents the total amount of interest, fees or dividends credited to income for the portion of the period an investment was included in Control or Affiliate categories, respectively. |
44
RAND CAPITAL CORPORATION AND SUBSIDIARY
CONSOLIDATED SCHEDULE OF PORTFOLIO INVESTMENTS
December 31, 2013 (Continued)
(Unaudited)
| Industry Classification |
Percentage of
Total Investments (at fair value) as of December 31, 2013 |
|||
| Manufacturing |
65.9 | % | ||
| Software |
13.5 | % | ||
| Electronics |
8.4 | % | ||
| Contact Center |
3.9 | % | ||
| Pharmaceuticals |
3.2 | % | ||
| Oil and Gas |
2.8 | % | ||
| Auto Parts |
1.9 | % | ||
| Marketing |
0.4 | % | ||
|
|
|
|||
| Total Investments |
100 | % | ||
|
|
|
|||
45
RAND CAPITAL CORPORATION AND SUBSIDIARY
For the Five Years Ended December 31, 2014, 2013, 2012, 2011 and 2010
The following is a schedule of financial highlights for the years ended December 31, 2014, 2013, 2012, 2011 and 2010:
| 2014 | 2013 | 2012 | 2011 | 2010 | ||||||||||||||||
| Per Share Data: |
||||||||||||||||||||
| Income from investment operations(1): |
||||||||||||||||||||
| Investment income |
$ | 0.40 | $ | 0.38 | $ | 0.39 | $ | 0.19 | $ | 0.12 | ||||||||||
| Expenses |
0.39 | 0.37 | 0.27 | 0.24 | 0.34 | |||||||||||||||
|
|
|
|
|
|
|
|
|
|
|
|||||||||||
| Investment gain (loss) before income taxes |
0.01 | 0.01 | 0.12 | (0.05 | ) | (0.22 | ) | |||||||||||||
| Income tax expense (benefit) |
0.01 | (0.01 | ) | 0.02 | (0.04 | ) | (0.08 | ) | ||||||||||||
|
|
|
|
|
|
|
|
|
|
|
|||||||||||
| Net investment gain (loss) |
0.00 | 0.02 | 0.10 | (0.01 | ) | (0.14 | ) | |||||||||||||
| Issuance of common stock |
0.00 | 0.00 | 0.00 | 0.00 | 0.00 | |||||||||||||||
| Purchase of treasury stock(2) |
0.02 | 0.04 | 0.04 | 0.00 | 0.00 | |||||||||||||||
| Net realized and unrealized gain (loss) on investments |
0.71 | 0.42 | 0.18 | 0.21 | 0.12 | |||||||||||||||
|
|
|
|
|
|
|
|
|
|
|
|||||||||||
| Increase (decrease) in net asset value |
0.73 | 0.48 | 0.32 | 0.20 | (0.02 | ) | ||||||||||||||
| Net asset value, beginning of year, based on weighted average shares |
4.38 | 3.90 | 3.58 | 3.38 | 3.40 | |||||||||||||||
|
|
|
|
|
|
|
|
|
|
|
|||||||||||
| Net asset value, end of year, based on weighted average shares |
$ | 5.11 | $ | 4.38 | $ | 3.90 | $ | 3.58 | $ | 3.38 | ||||||||||
|
|
|
|
|
|
|
|
|
|
|
|||||||||||
| Per share market value, end of year |
$ | 4.09 | $ | 3.07 | $ | 2.34 | $ | 3.10 | $ | 3.23 | ||||||||||
|
|
|
|
|
|
|
|
|
|
|
|||||||||||
| Total return based on market value |
33.2 | % | 31.2 | % | (24.5 | )% | (4.02 | )% | (18.84 | )% | ||||||||||
| Total return based on net asset value |
15.26 | % | 8.87 | % | 5.67 | % | 5.85 | % | (0.67 | )% | ||||||||||
| Supplemental Data: |
||||||||||||||||||||
| Ratio of expenses before income taxes to average net assets |
8.27 | % | 8.76 | % | 7.16 | % | 7.00 | % | 10.24 | % | ||||||||||
| Ratio of expenses including taxes to average net assets |
16.28 | % | 14.03 | % | 11.01 | % | 10.41 | % | 9.64 | % | ||||||||||
| Ratio of net investment (loss) gain to average net assets |
0.07 | % | 0.57 | % | 2.73 | % | (0.34 | )% | (4.21 | )% | ||||||||||
| Portfolio turnover |
21.5 | % | 17.9 | % | 22.6 | % | 11.7 | % | 16.5 | % | ||||||||||
| Net assets end of year |
$ | 32,353,441 | $ | 28,069,332 | $ | 25,782,300 | $ | 24,399,121 | $ | 23,050,818 | ||||||||||
| Weighted average shares outstanding, end of year |
6,391,175 | 6,513,385 | 6,770,389 | 6,818,934 | 6,818,934 | |||||||||||||||
| (1) | Per share data are based on shares outstanding and results are rounded. |
| (2) | Net increase is due to purchase of common stock at prices less than beginning of period net asset value per share. |
46
RAND CAPITAL CORPORATION AND SUBSIDIARY
NOTES TO THE CONSOLIDATED FINANCIAL STATEMENTS
NOTE 1. – SUMMARY OF SIGNIFICANT ACCOUNTING POLICIES
Nature of Business – Rand Capital Corporation (“Rand”) was incorporated under the laws of New York in 1969. Beginning in 1971, Rand operated as a publicly traded, closed-end, diversified management company that was registered under Section 8 of the Investment Company Act of 1940 (the “1940 Act”). In 2001 Rand elected to be treated as a business development company (“BDC”) under the 1940 Act. In 2002, Rand formed a wholly-owned subsidiary for the purpose of operating it as a small business investment company (“SBIC”) licensed by the U.S. Small Business Administration (“SBA”). The subsidiary received an SBA license to operate as an SBIC in August 2002. The subsidiary, which had been organized as a Delaware limited partnership, was converted into a New York corporation on December 31, 2008, at which time its operations as a licensed SBIC were continued by the newly formed corporation under the name of Rand Capital SBIC, Inc. (“Rand SBIC”). On February 28, 2012 the SEC granted an Order of Exemption for Rand with respect to the operations of Rand SBIC. At that time, although Rand SBIC was operated as if it were a BDC, it was registered as an investment company under the 1940 Act. Upon Rand’s receipt of the order granting the exemptions, on March 28, 2012, Rand SBIC filed an election to be regulated as a BDC under the 1940 Act. The following discussion describes the operations of Rand and its wholly-owned subsidiary Rand SBIC (collectively, the “Corporation”).
Principles of Consolidation – The consolidated financial statements include the accounts of Rand and its wholly-owned subsidiary Rand SBIC. All intercompany accounts and transactions have been eliminated in consolidation.
Investment Classification – In accordance with the provisions of the 1940 Act, the Corporation classifies its investments by level of control. Under the 1940 Act “Control Investments” are investments in companies that the Corporation is deemed to “Control” if it owns more than 25% of the voting securities of the company or has greater than 50% representation on the company’s board. “Affiliate Investments” are companies in which the Corporation owns between 5% and 25% of the voting securities. “Non-Control/Non-Affiliate Investments” are those companies that are neither Control Investments nor Affiliate Investments.
Investments – Investments are valued at fair value as determined in good faith by the Management of the Corporation and approved by the Board of Directors. The Corporation invests in loan instruments, debt instruments, and equity instruments. There is no single standard for determining fair value in good faith. As a result, determining fair value requires that judgment be applied to the specific facts and circumstances of each portfolio investment while employing a consistent valuation process for each investment. The Corporation analyzes and values each investment quarterly, and records unrealized depreciation for an investment that it believes has become impaired, including where collection of a loan or realization of the recorded value of an equity security is doubtful. Conversely, the Corporation will record unrealized appreciation if it believes that an underlying portfolio company has appreciated in value and, therefore, its equity security has also appreciated in value. These estimated fair values may differ from the values that would have been used had a ready market for the investments existed and these differences could be material if the Corporation’s assumptions and judgments differ from results of actual liquidation events.
Qualifying Assets – All of the Corporation’s investments were made to privately held small business enterprises, that were not investment companies, were principally based in the United States; and represent qualifying assets as defined by section 55(a) of the 1940 Act.
Revenue Recognition – Interest Income – Interest income is recognized on the accrual basis except where the investment is in default or otherwise presumed to be in doubt. In such cases, interest is recognized at the time of receipt. A reserve for possible losses on interest receivable is maintained when appropriate.
The Rand SBIC interest accrual is also regulated by the SBA’s “Accounting Standards and Financial Reporting Requirements for Small Business Investment Companies.” Under these rules interest income cannot be recognized if collection is doubtful, and a 100% reserve must be established. The collection of interest is presumed to be in doubt when there is substantial doubt about a portfolio company’s ability to continue as a
47
RAND CAPITAL CORPORATION AND SUBSIDIARY
NOTES TO THE CONSOLIDATED FINANCIAL STATEMENTS
going concern or the loan is in default more than 120 days. Management also uses other qualitative and quantitative measures to determine the value of a portfolio investment and the collectability of any accrued interest.
After reviewing the portfolio companies’ performance and the circumstances surrounding the investment, the Corporation ceased accruing interest income on G-Tec Natural Gas Systems in 2004 and Mezmeriz, Inc. in 2014.
The Corporation holds debt securities in its investment portfolio that contain payment-in-kind (“PIK”) interest provisions. The PIK interest, computed at the contractual rate specified in each debt agreement, is periodically added to the principal balance of the debt and is recorded as interest income. Thus, the actual collection of this interest may be deferred until the time of debt principal repayment.
Revenue Recognition – Dividend Income – The Corporation may receive distributions from portfolio companies that are limited liability companies or corporations and these distributions are classified as dividend income on the consolidated statement of operations. Dividend income is recognized on an accrual basis when it can be reasonably estimated.
The Corporation holds preferred equity securities that contain cumulative dividend provisions. Cumulative dividends are recorded as dividend income, and any dividends in arrears are added to the balance of the preferred equity investment. The actual collection of these dividends in arrears may be deferred until such time as the preferred equity is redeemed.
Revenue Recognition – Fee Income – Consists of the revenue associated with the amortization of financing fees charged to the portfolio companies upon successful closing of Rand SBIC financings and income associated with portfolio company board attendance fees. The income associated with the amortization of financing fees was $16,200, $7,400 and $2,136 for the years ended December 31, 2014, 2013 and 2012, respectively and is estimated to be $14,000 in 2015, $6,000 in 2016, and $4,000 in 2017. The board fees were $14,000, $16,000 and $11,000 for the years ended December 31, 2014, 2013 and 2012, respectively.
Realized Gain or Loss and Unrealized Appreciation or Depreciation of Investments – Amounts reported as realized gains and losses are measured by the difference between the proceeds from the sale or exchange and the cost basis of the investment without regard to unrealized gains or losses recorded in prior periods. The cost of securities that have, in management’s judgment, become worthless are written off and reported as realized losses when appropriate. Unrealized appreciation or depreciation reflects the difference between the valuation of the investments and the cost basis of the investments.
Original Issue Discount – Investments may include “original issue discount” or OID income. This occurs when the Corporation purchases a warrant and a note from a portfolio company simultaneously, which requires an allocation of a portion of the purchase price to the warrant and reduces the note or debt instrument by an equal amount in the form of a note discount or OID. The note is reported net of the OID and the OID is accreted into interest income over the life of the loan. The Corporation did not record any OID in 2014 or 2013 and recorded three OID’s during the year ended December 31, 2012 for $209,000. The Corporation recognized $15,492, $15,492 and $19,028 in OID income for the years ended December 31, 2014, 2013 and 2012, respectively. OID income for the next three years is estimated to average $12,000 per year.
Deferred Debenture Costs – SBA debenture origination and commitment costs, which are included in other assets, will be amortized ratably over the terms of the SBA debentures. Amortization expense during the years ended December 31, 2014, 2013 and 2012 was $24,686, $37,958 and $64,073, respectively. Amortization expense for the next five years is estimated to average $27,000 per year.
Net Assets Per Share – Net assets per share are based on the number of shares of common stock outstanding. There are no common stock equivalents.
48
RAND CAPITAL CORPORATION AND SUBSIDIARY
NOTES TO THE CONSOLIDATED FINANCIAL STATEMENTS
Supplemental Cash Flow Information – Income taxes paid (refunded) during the years ended December 31, 2014, 2013 and 2012 amounted to $1,945,879, $962,697 and ($145,539), respectively. Interest paid during the years ended December 31, 2014, 2013 and 2012 was $220,667, $128,083 and $135,870, respectively. During 2014, 2013 and 2012, the Corporation converted $211,127, $310,322 and $131,825, respectively, of interest receivable and payment-in-kind interest (PIK) into debt investments. During the year ended December 31, 2014, the Corporation exchanged membership interests in QuaDPharma, LLC in the amount of $143,285 for common shares of Kinex Pharmaceuticals, Inc. During the year ended December 31, 2014, the Corporation recorded one escrow receivable for $1,510,248 from the sale of BinOptics Corporation. In addition, during 2014 the Corporation collected escrows of $680,612 from Liazon Corporation and $160,847 from Ultra-Scan Corporation. During the year ended December 31, 2013, the Corporation recorded two escrow receivables for $1,153,277 and $189,141 in connection with the sale of Liazon Corporation and Ultra-Scan Corporation, respectively. During the year ended December 31, 2012, the Corporation collected escrows of $957,563 from GridApp Systems, Inc. (GridApp), $700,000 from Innov-X Systems, Inc. and $157,775 from Kionix, Inc. (Kionix).
Concentration of Credit and Market Risk – The Corporation’s financial instruments potentially subject it to concentrations of credit risk. Cash is invested with banks in amounts which, at times, exceed insurable limits. Management does not anticipate non-performance by the banks.
As of December 31, 2014, 57% of the Corporation’s total investment value was held in five notes and equity securities. As of December 31, 2013, 63% of the Corporation’s total investment value was held in five notes and equity securities.
Income Taxes – The Corporation reviews the tax positions it has taken to determine if they meet the “more likely than not threshold” for the benefit of the tax position to be recognized in the financial statements. A tax position that fails to meet the more likely than not recognition threshold will result in either a reduction of a current or deferred tax asset or receivable, or the recording of a current or deferred tax liability.
Accounting Estimates – The preparation of financial statements in conformity with accounting principles generally accepted in the United States of America (GAAP) requires management to make estimates and assumptions that affect the reported amounts of assets and liabilities and disclosure of contingent assets and liabilities at the date of the financial statements and the reported amounts of revenues and expenses during the reporting period. Actual results could differ from those estimates.
Fair Value of Financial Instruments – The carrying amounts reported in the consolidated statement of financial position of cash, interest receivable, accounts payable and accrued expenses approximate fair value because of the immediate or short-term maturity of these financial instruments.
Fair Value of SBA Leverage – In September 2014 the SBA pooled its debenture borrowings and they were put to market and competitively priced. The market rate for these debentures was set at 3.015% excluding a mandatory SBA annual charge estimated to be 0.804%; resulting in a total estimated fixed rate for ten years of 3.82%. The carrying value of SBA debentures is a reasonable estimate of fair value because stated interest rates approximate current interest rates that are available for debt with similar terms.
Reclassification – Certain balances in prior years were reclassified to conform to presentations adopted in 2014.
NOTE 2. – INVESTMENTS
The Corporation’s investments are carried at fair value in accordance with Accounting Standards Codification (ASC) 820, “fair value measurements and disclosures”, which defines fair value, establishes a framework for measuring fair value in GAAP, and expands disclosures about fair value measurements.
49
RAND CAPITAL CORPORATION AND SUBSIDIARY
NOTES TO THE CONSOLIDATED FINANCIAL STATEMENTS
Loan investments are defined as traditional loan financings with no equity features. Debt investments are defined as debt financings that include one or more equity features such as conversion rights, stock purchase warrants, and/or stock purchase options. A financing may also be categorized as a debt financing if it is accompanied by the direct purchase of an equity interest in the company.
The Corporation uses several approaches to determine the fair value of an investment. The main approaches are:
| • | Loan and debt securities are valued at cost when it is representative of the fair value of an investment or sufficient assets or liquidation proceeds are expected to exist from a sale of a portfolio company at its estimated fair value. |
The loan and debt securities may also be valued at an amount other than the price the security would command in order to provide a yield to maturity equivalent to the current yield of similar debt securities. A loan or debt instrument may be reduced in value if it is judged to be of poor quality, collection is in doubt or insufficient liquidation proceeds exist.
| • | Equity securities may be valued using the “market approach” or “income approach.” The market approach uses observable prices and other relevant information generated by similar market transactions. It may include the use of market multiples derived from a set of comparables to assist in pricing the investment. Additionally, the Corporation adjusts valuations if a subsequent significant equity financing has occurred that includes a meaningful portion of the financing by a sophisticated, unrelated new investor. The income approach employs a cash flow and discounting methodology to value an investment. |
ASC 820 classifies the inputs used to measure fair value into the following hierarchy:
Level 1: Quoted prices in active markets for identical assets or liabilities, used in the Corporation’s valuation at the measurement date.
Level 2: Quoted prices for similar assets or liabilities in active markets, or quoted prices for identical or similar assets or liabilities in markets that are not active, or other observable inputs other than quoted prices.
Level 3: Unobservable and significant inputs to determining the fair value.
Financial assets are categorized based upon the level of judgment associated with the inputs used to measure their fair value.
Any changes in estimated fair value are recorded in the statement of operations as “Net (decrease) increase in unrealized appreciation on investments.”
Under the valuation policy, the Corporation values unrestricted publicly traded companies at the average closing bid price for the last three trading days of the reporting period.
In the valuation process, the Corporation values private securities, categorized as Level 3 investments, using financial information from these portfolio companies, which may include:
| • | Financial information obtained from each portfolio company, including unaudited statements of operations, balance sheets and operating budgets; |
| • | Current and projected financial, operational and technological developments of the portfolio company; |
| • | Current and projected ability of the portfolio company to service its debt obligations; |
| • | The current capital structure of the business and the seniority of the various classes of equity if a deemed liquidation event were to occur; |
| • | Pending debt or capital restructuring of the portfolio company; |
50
RAND CAPITAL CORPORATION AND SUBSIDIARY
NOTES TO THE CONSOLIDATED FINANCIAL STATEMENTS
| • | Current information regarding any offers to purchase the investment; or past sales transactions; |
| • | Current ability of the portfolio company to raise additional financing if needed; |
| • | Changes in the economic environment which may have a material impact on the operating results of the portfolio company; |
| • | Internal occurrences that may have an impact (both positive and negative) on the operating performance of the portfolio company; |
| • | Qualitative assessment of key management; |
| • | Contractual rights, obligations or restrictions associated with the investment; and |
| • | Other factors deemed relevant to assess valuation. |
This information is used to determine financial condition, performance, and valuation of the portfolio companies. The valuation may be reduced if a portfolio company’s performance and potential have deteriorated significantly. If the factors which led to a reduction in valuation are overcome, the valuation may be readjusted.
Equity Securities
Equity Securities may include Preferred Stock, Common Stock, Warrants and Limited Liability Company Interests.
The significant unobservable inputs used in the fair value measurement of the Corporation’s equity investments are EBITDA and revenue multiples, where applicable, the financial and operational performance of the business, and the senior equity preferences which may exist in a deemed liquidation event. Standard industry multiples may be used when available; however, the Corporation’s portfolio companies are typically small and in early stages of development and these industry standards may be adjusted to more closely match the specific financial and operational performance of the portfolio company. Due to the nature of certain investments, fair value measurements may be based on other criteria, which may include third party appraisals. Significant changes to the unobservable inputs, such as variances in financial performance from expectations, may result in a significantly higher or lower fair value measurement.
Another key factor used in valuing equity investments is recent arms-length equity transactions with unrelated new investors entered into by the portfolio company. The terms of these equity transactions may not be identical to the equity transactions between the portfolio company and the Corporation, and the impact of the difference in transaction terms on the market value of the portfolio company may be difficult or impossible to quantify.
When appropriate the Black-Scholes pricing model is used to estimate the fair value of warrants for accounting purposes. This model requires the use of highly subjective inputs including expected volatility and expected life, in addition to variables for the valuation of minority equity positions in small private and early stage companies. Significant increases or decreases in any of these unobservable inputs may result in a significantly higher or lower fair value measurement.
For recent investments, the Corporation generally relies on the cost basis, which is deemed to represent the fair value, unless other fair market value inputs are identified causing the Corporation to depart from this basis.
Loan and Debt Securities
The significant unobservable inputs used in the fair value measurement of the Corporation’s loan and debt securities are the financial and operational performance of the portfolio company, similar debt with similar terms with other portfolio companies, as well as the market acceptance for the portfolio company’s products or services. These inputs will provide an indicator as to the probability of principal recovery of the investment. The
51
RAND CAPITAL CORPORATION AND SUBSIDIARY
NOTES TO THE CONSOLIDATED FINANCIAL STATEMENTS
Corporation’s loan and debt investments are often junior secured or unsecured debt securities. Fair value may also be determined based on other criteria where appropriate. Significant changes to the unobservable inputs may result in a change in fair value. For recent investments, the Corporation generally relies on the cost basis, which is deemed to represent the fair value, unless other fair market value inputs are identified causing the Corporation to depart from this level.
The following table provides a summary of the significant unobservable inputs used to fair value the Corporation’s Level 3 portfolio investments as of December 31, 2014:
| Investment Type |
Market Approach EBITDA Multiple |
Market Approach Liquidation Seniority |
Market Approach Revenue Multiple |
Market Approach Transaction Pricing |
Black Scholes Pricing Model Stock Pricing & Volatility |
Face Value Liquidation Seniority |
Totals | |||||||||||||||||||||
| Non-Control/Non-Affiliate Equity |
$ | 786,748 | $ | — | $ | — | $ | 2,204,628 | $ | 97,625 | $ | — | $ | 3,089,001 | ||||||||||||||
|
|
|
|
|
|
|
|
|
|
|
|
|
|
|
|||||||||||||||
| Non-Control/Non-Affiliate Debt |
— | — | — | — | — | 1,970,697 | 1,970,697 | |||||||||||||||||||||
|
|
|
|
|
|
|
|
|
|
|
|
|
|
|
|||||||||||||||
| Total Non-Control/Non-Affiliate |
$ | 786,748 | $ | — | $ | — | $ | 2,204,628 | $ | 97,625 | $ | 1,970,697 | $ | 5,059,698 | ||||||||||||||
|
|
|
|
|
|
|
|
|
|
|
|
|
|
|
|||||||||||||||
| Affiliate Equity |
$ | 2,113,348 | $ | 22,841 | $ | 100,000 | $ | 8,945,546 | $ | 22,000 | $ | — | $ | 11,203,735 | ||||||||||||||
|
|
|
|
|
|
|
|
|
|
|
|
|
|
|
|||||||||||||||
| Affiliate Debt |
— | — | — | — | — | 3,413,643 | 3,413,643 | |||||||||||||||||||||
|
|
|
|
|
|
|
|
|
|
|
|
|
|
|
|||||||||||||||
| Total Affiliate |
$ | 2,113,348 | $ | 22,841 | $ | 100,000 | $ | 8,945,546 | $ | 22,000 | $ | 3,413,643 | $ | 14,617,378 | ||||||||||||||
|
|
|
|
|
|
|
|
|
|
|
|
|
|
|
|||||||||||||||
| Control Equity |
$ | 9,399,500 | $ | — | $ | — | $ | — | $ | — | $ | — | $ | 9,399,500 | ||||||||||||||
|
|
|
|
|
|
|
|
|
|
|
|
|
|
|
|||||||||||||||
| Control Debt |
— | — | — | — | — | 622,800 | 622,800 | |||||||||||||||||||||
|
|
|
|
|
|
|
|
|
|
|
|
|
|
|
|||||||||||||||
| Total Control |
$ | 9,399,500 | $ | — | $ | — | $ | — | $ | — | $ | 622,800 | $ | 10,022,300 | ||||||||||||||
|
|
|
|
|
|
|
|
|
|
|
|
|
|
|
|||||||||||||||
| Total Level 3 Investments |
$ | 12,299,596 | $ | 22,841 | $ | 100,000 | $ | 11,150,174 | $ | 119,625 | $ | 6,007,140 | $ | 29,699,376 | ||||||||||||||
|
|
|
|
|
|
|
|
|
|
|
|
|
|
|
|||||||||||||||
| Range |
4.5X-10X | 1X | 1X | Not Applicable | $1.13 | Not Applicable | ||||||||||||||||||||||
| Weighted Average |
5X | 1X | 1X | N/A | $1.13 | N/A | ||||||||||||||||||||||
The following table provides a summary of the components of Level 1, 2 and 3 Assets Measured at Fair Value on a Recurring Basis at December 31, 2014:
| Fair Value Measurements at Reported Date Using | ||||||||||||||||
| Description |
December 31, 2014 |
Quoted Prices in Active Markets for Identical Assets (Level 1) |
Significant Observable Inputs (Level 2) |
Other
Significant Unobservable Inputs (Level 3) |
||||||||||||
| Loan investments |
$ | 622,801 | $ | — | $ | — | $ | 622,801 | ||||||||
| Debt investments |
5,384,339 | — | — | 5,384,339 | ||||||||||||
| Equity investments |
24,298,236 | 606,000 | — | 23,692,236 | ||||||||||||
|
|
|
|
|
|
|
|
|
|||||||||
| Total |
$ | 30,305,376 | $ | 606,000 | $ | 0 | $ | 29,699,376 | ||||||||
|
|
|
|
|
|
|
|
|
|||||||||
52
RAND CAPITAL CORPORATION AND SUBSIDIARY
NOTES TO THE CONSOLIDATED FINANCIAL STATEMENTS
The following table provides a summary of changes in Assets Measured at Fair Value on a Recurring Basis Using Significant Unobservable Inputs (Level 3) for the year ended December 31, 2014:
| Fair Value Measurements Using
Significant Unobservable Inputs (Level 3) Venture Capital Investments |
||||||||||||||||
| Description |
Loan Investments |
Debt Investments |
Equity Investments |
Total | ||||||||||||
| Ending Balance, December 31, 2013, of Level 3 Assets |
$ | 1,466,604 | $ | 4,172,417 | $ | 21,655,032 | $ | 27,294,053 | ||||||||
| Realized Gains (Losses) included in net change in net assets from operations |
||||||||||||||||
| BinOptics Corporation (Binoptics) |
— | — | 8,333,344 | 8,333,344 | ||||||||||||
| EmergingMed.com, Inc. (Emerging Med) |
— | (778,253 | ) | — | (778,253 | ) | ||||||||||
| Liazon Corporation (Liazon) |
— | — | (472,664 | ) | (472,664 | ) | ||||||||||
| QuaDPharma, LLC (Quadpharma) |
— | — | 160,634 | 160,634 | ||||||||||||
| Ultra-Scan Corporation (Ultra-Scan) |
— | — | 4,668 | 4,668 | ||||||||||||
|
|
|
|
|
|
|
|
|
|||||||||
| Total Realized Gains (Losses) |
— | (778,253 | ) | 8,025,982 | 7,247,729 | |||||||||||
| Unrealized Gains (Losses) included in net change in net assets from operations |
||||||||||||||||
| CrowdBouncer, Inc. (Crowdbouncer) |
— | — | (300,000 | ) | (300,000 | ) | ||||||||||
| Emerging Med |
— | 778,253 | — | 778,253 | ||||||||||||
| Kinex Pharmaceuticals, Inc. (Kinex) |
— | — | 111,343 | 111,343 | ||||||||||||
| Knoa Software, Inc. (Knoa) |
— | — | (356,900 | ) | (356,900 | ) | ||||||||||
| Mezmeriz, Inc. (Mezmeriz) |
— | — | (391,373 | ) | (391,373 | ) | ||||||||||
| NDT Acquisitions, LLC (NDT) |
— | — | 5,336 | 5,336 | ||||||||||||
|
|
|
|
|
|
|
|
|
|||||||||
| Total Unrealized Gains (Losses) |
— | 778,253 | (931,594 | ) | (153,341 | ) | ||||||||||
| Purchases of Securities/Changes to Securities/Non-cash conversions: |
||||||||||||||||
| BeetNPath, LLC (Beetnpath) |
— | 150,000 | — | 150,000 | ||||||||||||
| Chequed.com, Inc. (Chequed) |
— | 250,000 | 350,000 | 600,000 | ||||||||||||
| Crashmob, Inc. (Crashmob) |
— | — | 500,000 | 500,000 | ||||||||||||
| Crowdbouncer |
— | — | 300,000 | 300,000 | ||||||||||||
| Empire Genomics, LLC (Empire Genomics) |
— | 600,000 | — | 600,000 | ||||||||||||
| First Wave Products Group, LLC (First Wave) |
— | 170,844 | — | 170,844 | ||||||||||||
| GiveGab, Inc. (Give Gab) |
— | — | 153,388 | 153,388 | ||||||||||||
| Kinex |
— | — | 143,285 | 143,285 | ||||||||||||
| Knoa |
— | — | 479,155 | 479,155 | ||||||||||||
| KnowledgeVision Systems, Inc. (Knowledge Vision) |
— | — | 300,000 | 300,000 | ||||||||||||
| Liazon |
— | — | 476,334 | 476,334 | ||||||||||||
| Mercantile Adjustment Bureau, LLC (Mercantile) |
— | 166,078 | 47,625 | 213,703 | ||||||||||||
| OnCore Golf Technology, Inc. (Oncore Golf) |
— | — | 200,000 | 200,000 | ||||||||||||
| Quadpharma |
— | — | (143,285 | ) | (143,285 | ) | ||||||||||
| SciAps, Inc. (Sciaps) |
— | — | 500,000 | 500,000 | ||||||||||||
| SocialFlow, Inc. (Social Flow) |
— | — | 750,000 | 750,000 | ||||||||||||
| Teleservices Solutions Holdings, LLC (Teleservices Holdings) |
— | — | 1,400,680 | 1,400,680 | ||||||||||||
|
|
|
|
|
|
|
|
|
|||||||||
| Total Purchases of Securities/Changes to Securities/Non-cash conversions |
— | 1,336,922 | 5,457,182 | 6,794,104 | ||||||||||||
| Repayments of Securities |
||||||||||||||||
| Binoptics |
— | — | (10,133,343 | ) | (10,133,343 | ) | ||||||||||
| Carolina Skiff LLC (Carolina Skiff) |
— | (125,000 | ) | — | (125,000 | ) | ||||||||||
| Gemcor II, LLC (Gemcor) |
(287,518 | ) | — | — | (287,518 | ) | ||||||||||
| Liazon |
— | — | (3,670 | ) | (3,670 | ) | ||||||||||
| Quadpharma |
(556,285 | ) | — | (367,349 | ) | (923,634 | ) | |||||||||
| NDT |
— | — | (5,336 | ) | (5,336 | ) | ||||||||||
| Ultra-Scan |
— | — | (4,668 | ) | (4,668 | ) | ||||||||||
|
|
|
|
|
|
|
|
|
|||||||||
| Total Repayments of Securities |
(843,803 | ) | (125,000 | ) | (10,514,366 | ) | (11,483,169 | ) | ||||||||
| Transfers within Level 3 |
— | — | — | — | ||||||||||||
|
|
|
|
|
|
|
|
|
|||||||||
| Ending Balance, December 31, 2014, of Level 3 Assets |
$ | 622,801 | $ | 5,384,339 | $ | 23,692,236 | $ | 29,699,376 | ||||||||
|
|
|
|
|
|
|
|
|
|||||||||
| Change in unrealized appreciation on investments for the period included in changes in net assets |
|
($ | 153,341 | ) | ||||||||||||
| Net realized gains (losses) on investments for the period included in changes in net assets |
|
$ | 7,247,729 | |||||||||||||
53
RAND CAPITAL CORPORATION AND SUBSIDIARY
NOTES TO THE CONSOLIDATED FINANCIAL STATEMENTS
The following table provides a summary of the significant unobservable inputs used to fair value the Corporation’s Level 3 portfolio investments as of December 31, 2013:
| Investment Type |
Fair Value
at December 31, 2013 |
Valuation Technique |
Significant |
Range | ||||||
| Equity Investments |
$ | 11,671,748 | Market Approach | EBITDA Multiple | 5X-10X | |||||
| 22,841 | Market Approach | Liquidation Seniority | 1X | |||||||
| 99,500 | Market Approach | Revenue Multiple | 1X | |||||||
| 9,788,943 | Market Approach | Transaction Pricing | Not applicable | |||||||
| 72,000 | Black Scholes Pricing Model | Stock pricing and volatility | $1.13 | |||||||
| Loan and Debt Investments |
5,639,021 | Face Value | Liquidation Seniority | Not applicable | ||||||
|
|
|
|||||||||
| Total |
$ | 27,294,053 | ||||||||
|
|
|
|||||||||
The following table provides a summary of the components of Level 1, 2 and 3 Assets Measured at Fair Value on a Recurring Basis at December 31, 2013:
| Fair Value Measurements at Reported
Date Using |
||||||||||||||||
| Description |
December 31, 2013 |
Quoted Prices in Active Markets for Identical Assets (Level 1) |
Significant Observable Inputs (Level 2) |
Other
Significant Unobservable Inputs (Level 3) |
||||||||||||
| Loan investments |
$ | 1,466,604 | $ | — | $ | — | $ | 1,466,604 | ||||||||
| Debt investments |
4,172,417 | — | — | 4,172,417 | ||||||||||||
| Equity investments |
22,709,532 | 1,054,500 | — | 21,655,032 | ||||||||||||
|
|
|
|
|
|
|
|
|
|||||||||
| Total Venture Capital Investments |
$ | 28,348,553 | $ | 1,054,500 | $ | 0 | $ | 27,294,053 | ||||||||
|
|
|
|
|
|
|
|
|
|||||||||
54
RAND CAPITAL CORPORATION AND SUBSIDIARY
NOTES TO THE CONSOLIDATED FINANCIAL STATEMENTS
The following table provides a summary of changes in Assets Measured at Fair Value on a Recurring Basis Using Significant Unobservable Inputs (Level 3) for the year ended December 31, 2013:
| Fair Value Measurements Using
Significant Unobservable Inputs (Level 3) Venture Capital Investments |
||||||||||||||||
| Description |
Loan Investments |
Debt Investments |
Equity Investments |
Total | ||||||||||||
| Ending Balance, December 31, 2012, of Level 3 Assets |
$ | 1,504,986 | $ | 4,082,174 | $ | 20,652,226 | $ | 26,239,386 | ||||||||
| Realized Gains (Losses) included in net change in net assets from operations |
||||||||||||||||
| APF Products Group, Inc. (APF) |
— | 6,912 | — | 6,912 | ||||||||||||
| Liazon Corporation (Liazon) |
— | — | 6,256,482 | 6,256,482 | ||||||||||||
| Mid America Brick & Structural Clay Products, LLC (Mid America Brick) |
— | (126,698 | ) | (937,000 | ) | (1,063,698 | ) | |||||||||
| Ultra-Scan Corporation (Ultra-Scan) |
— | — | 669,939 | 669,939 | ||||||||||||
|
|
|
|
|
|
|
|
|
|||||||||
| Total Realized (Losses) Gains |
— | (119,786 | ) | 5,989,421 | 5,869,635 | |||||||||||
| Unrealized Gains (Losses) included in net change in net assets from operations |
||||||||||||||||
| Carolina Skiff LLC (Carolina Skiff) |
— | — | 350,000 | 350,000 | ||||||||||||
| EmergingMed.com, Inc. (Emerging Med) |
— | (440,707 | ) | — | (440,707 | ) | ||||||||||
| Liazon |
— | — | (975,133 | ) | (975,133 | ) | ||||||||||
| Mid America Brick |
— | 126,698 | 937,000 | 1,063,698 | ||||||||||||
| NDT Acquisitions, LLC (NDT) |
— | — | 19,177 | 19,177 | ||||||||||||
| Ultra-Scan |
— | — | (561,836 | ) | (561,836 | ) | ||||||||||
|
|
|
|
|
|
|
|
|
|||||||||
| Total Unrealized Gains and Losses |
— | (314,009 | ) | (230,792 | ) | (544,801 | ) | |||||||||
| Purchases of Securities/Changes to Securities/Non-cash conversions: |
||||||||||||||||
| Chequed.com, Inc. (Chequed) |
— | — | 500,000 | 500,000 | ||||||||||||
| Emerging Med |
— | 103,207 | — | 103,207 | ||||||||||||
| First Wave Products Group, LLC (First Wave) |
— | 265,405 | — | 265,405 | ||||||||||||
| GiveGab, Inc. (Give Gab) |
— | — | 250,000 | 250,000 | ||||||||||||
| Intrinsiq Material, Inc. (Intrinsiq) |
— | — | 600,002 | 600,002 | ||||||||||||
| KnowledgeVision Systems, Inc. (Knowledge Vision) |
— | — | 250,000 | 250,000 | ||||||||||||
| Mercantile Adjustment Bureau, LLC (Mercantile) |
— | 102,952 | — | 102,952 | ||||||||||||
| Mezmeriz, Inc. (Mezmeriz) |
— | 200,000 | 19,864 | 219,864 | ||||||||||||
| Microcision LLC (Microcision) |
— | 109,386 | — | 109,386 | ||||||||||||
| Mid America Brick |
150,000 | — | — | 150,000 | ||||||||||||
| QuaDPharma, LLC (Quadpharma) |
250,000 | — | — | 250,000 | ||||||||||||
| Rheonix, Inc. (Rheonix) |
— | — | 891,271 | 891,271 | ||||||||||||
| SciAps, Inc. (Sciaps) |
— | — | 1,000,000 | 1,000,000 | ||||||||||||
| SocialFlow, Inc. (Social Flow) |
— | — | 500,000 | 500,000 | ||||||||||||
|
|
|
|
|
|
|
|
|
|||||||||
| Total Purchases of Securities/Changes to Securities/Non-cash conversions |
400,000 | 780,950 | 4,011,137 | 5,192,087 | ||||||||||||
| Repayments of Securities |
||||||||||||||||
| APF |
— | (6,912 | ) | — | (6,912 | ) | ||||||||||
| Gemcor II, LLC (Gemcor) |
(261,498 | ) | — | — | (261,498 | ) | ||||||||||
| Liazon |
— | — | (7,389,681 | ) | (7,389,681 | ) | ||||||||||
| Mid America Brick |
(150,000 | ) | — | — | (150,000 | ) | ||||||||||
| NDT |
— | — | (19,177 | ) | (19,177 | ) | ||||||||||
| Quadpharma |
(26,884 | ) | — | — | (26,884 | ) | ||||||||||
| UltraScan |
— | — | (1,608,103 | ) | (1,608,103 | ) | ||||||||||
|
|
|
|
|
|
|
|
|
|||||||||
| Total Repayments of Securities |
(438,382 | ) | (6,912 | ) | (9,016,961 | ) | (9,462,255 | ) | ||||||||
| Transfers within Level 3 |
— | (250,000 | ) | 250,001 | 1 | |||||||||||
|
|
|
|
|
|
|
|
|
|||||||||
| Ending Balance, December 31, 2013, of Level 3 Assets |
$ | 1,466,604 | $ | 4,172,417 | $ | 21,655,032 | $ | 27,294,053 | ||||||||
|
|
|
|
|
|
|
|
|
|||||||||
| Change in unrealized gains (losses) for the period included in changes in net assets |
|
($ | 544,801 | ) | ||||||||||||
| Total gains (losses) for the period included in changes in net assets |
|
$ | 5,869,635 | |||||||||||||
55
RAND CAPITAL CORPORATION AND SUBSIDIARY
NOTES TO THE CONSOLIDATED FINANCIAL STATEMENTS
NOTE 3. – OTHER ASSETS
At December 31, 2014 and 2013, other assets was comprised of the following:
| 2014 | 2013 | |||||||
| Escrow receivable from BinOptics Corporation |
$ | 1,510,248 | $ | — | ||||
| Deferred debenture costs, net |
227,027 | 227,463 | ||||||
| Dividend receivable |
37,978 | — | ||||||
| Escrow receivable from Ultra-Scan |
32,962 | 189,141 | ||||||
| Equipment (net) |
14,558 | 6,747 | ||||||
| Operating receivables |
2,027 | 2,286 | ||||||
| Escrow receivable from Liazon |
— | 1,153,277 | ||||||
|
|
|
|
|
|||||
| Total other assets |
$ | 1,824,800 | $ | 1,578,914 | ||||
|
|
|
|
|
|||||
During 2014 the Corporation sold its investment in BinOptics Corporation and a portion of the proceeds were held in escrow and is scheduled to be released during 2016. During 2013 the Corporation sold its investment’s in Liazon Corporation (Liazon) and Ultra-Scan Corporation (Ultra-Scan) and a portion of the sales proceeds were held in escrow. A portion of the Liazon escrow was received in 2014 and the remaining amount was written off as a realized loss. A portion of the Ultra-Scan escrow was released during 2014 and the remainder is expected to be received during 2015.
NOTE 4. – INCOME TAXES
Deferred tax assets and liabilities are recorded for temporary differences between the financial statement and tax bases of assets and liabilities using the tax rate expected to be in effect when the taxes are actually paid or recovered.
The tax effect of the major temporary differences and carryforwards that give rise to the Corporation’s net deferred tax assets and (liabilities) at December 31, 2014 and 2013 are approximately as follows:
| 2014 | 2013 | |||||||
| Operations |
$ | 288,000 | $ | (98,000 | ) | |||
| Investments |
(2,170,000 | ) | (2,274,000 | ) | ||||
| Tax credit carryforwards |
44,000 | 165,000 | ||||||
|
|
|
|
|
|||||
| Deferred tax liability, net |
$ | (1,838,000 | ) | $ | (2,207,000 | ) | ||
|
|
|
|
|
|||||
The major temporary differences cited above include differences in the book and tax bases of the Corporation’s joint venture investments, as well as unrealized gains and losses on corporate investments that will be taxed when realized in future years. The Corporation assesses the recoverability of its deferred tax assets annually to determine if a valuation allowance is necessary. In performing this assessment, it considers estimated future taxable income and ongoing tax planning strategies. No allowance was deemed necessary for 2014 and 2013.
56
RAND CAPITAL CORPORATION AND SUBSIDIARY
NOTES TO THE CONSOLIDATED FINANCIAL STATEMENTS
The components of income tax expense (benefit) reported in the statements of operations are as follows for the years ended December 31:
| 2014 | 2013 | 2012 | ||||||||||
| Current: |
||||||||||||
| Federal |
$ | 2,670,129 | $ | 1,946,727 | $ | 603,124 | ||||||
| State |
118,118 | 211,702 | 101,821 | |||||||||
|
|
|
|
|
|
|
|||||||
| 2,788,247 | 2,158,429 | 704,945 | ||||||||||
|
|
|
|
|
|
|
|||||||
| Deferred: |
||||||||||||
| Federal |
(437,470 | ) | (534,640 | ) | 161,889 | |||||||
| State |
69,013 | (205,166 | ) | 101,086 | ||||||||
|
|
|
|
|
|
|
|||||||
| (368,457 | ) | (739,806 | ) | 262,975 | ||||||||
|
|
|
|
|
|
|
|||||||
| Total |
$ | 2,419,790 | $ | 1,418,623 | $ | 967,920 | ||||||
|
|
|
|
|
|
|
|||||||
A reconciliation of the expense (benefit) for income taxes at the federal statutory rate to the expense reported is as follows:
| 2014 | 2013 | 2012 | ||||||||||
| Net investment gain, realized gain and unrealized gain before income tax expense |
$ | 6,961,271 | $ | 4,291,980 | $ | 2,907,687 | ||||||
|
|
|
|
|
|
|
|||||||
| Expected tax expense at statutory rate |
$ | 2,366,832 | $ | 1,459,273 | $ | 988,614 | ||||||
| State - net of federal effect |
123,506 | 13,096 | 133,919 | |||||||||
| Pass-through benefit from Portfolio Investment |
(71,850 | ) | (51,156 | ) | (47,616 | ) | ||||||
| IRS Audit Adjustment |
— | — | (85,257 | ) | ||||||||
| Dividend Received Deduction |
(5,436 | ) | (8,154 | ) | (23,300 | ) | ||||||
| Other |
6,738 | 5,564 | 1,560 | |||||||||
|
|
|
|
|
|
|
|||||||
| Total |
$ | 2,419,790 | $ | 1,418,623 | $ | 967,920 | ||||||
|
|
|
|
|
|
|
|||||||
At December 31, 2014 and 2013 the Corporation had no federal net operating loss carryforwards or capital loss carryforwards. For state tax purposes, there was a net operating loss carryforward of $24,569 at December 31, 2013. For state tax purposes the Corporation had a NYS Qualified Emerging Technology Company (QETC) tax credit carryforward of $24,281 and $153,562 at December 31, 2014 and 2013. The QETC credit carryforward does not have an expiration date. The Corporation also has a Georgia Employer’s Jobs Tax Credit carryforward of $20,045 and $11,678 at December 31, 2014 and 2013 and this credit expires in the next nine to ten years.
A reconciliation of the beginning and ending amount of uncertain tax benefits is as follows:
| Balance at December 31, 2011 |
$ | 72,500 | ||
| Decreases for settlements with taxing authorities |
(64,000 | ) | ||
|
|
|
|||
| Balance at December 31, 2012 |
8,500 | |||
|
|
|
|||
| Increases/Decreases |
— | |||
|
|
|
|||
| Balance at December 31, 2013 |
8,500 | |||
|
|
|
|||
| Increases/Decreases |
— | |||
|
|
|
|||
| Balance at December 31, 2014 |
$ | 8,500 | ||
|
|
|
57
RAND CAPITAL CORPORATION AND SUBSIDIARY
NOTES TO THE CONSOLIDATED FINANCIAL STATEMENTS
The Corporation is currently open to audit under the statute of limitations by the Internal Revenue Service for the years ending December 31, 2011 through 2014. In general, the Corporation’s state income tax returns are open to audit under the statute of limitations for the years ended December 31, 2011 through 2014. The total amount of uncertain tax benefits at December 31, 2014 was $8,500, all of which would affect the effective tax rate if recognized. The Corporation does not expect that the amounts of uncertain tax positions will change significantly within the next 12 months.
It is the Corporation’s policy to include interest and penalties related to income tax liabilities in income tax expense on the Statement of Operations. There was no amount recognized for interest and penalties related to unrecognized tax benefits for the years ended December 31, 2014, 2013, and 2012.
NOTE 5. – SBA DEBENTURE OBLIGATIONS
At December 31, 2014 and 2013, Rand SBIC had debentures payable to and guaranteed by the SBA totaling $8,000,000 and $7,000,000, respectively. The weighted average interest rate at December 31, 2014 was 3.29%. During 2013 the Corporation repaid $900,000 of its outstanding SBA leverage. The Corporation drew down $1,000,000 and $3,000,000 in additional leverage during 2014 and 2013, respectively.
The debenture terms require semiannual payments of interest at annual interest rates ranging from 2.245% to 3.644%, plus an annual charge of 0.804%.The interim interest rates on the $1,000,000 debentures drawn down in November 2014 was 0.569%, plus an annual charge of 0.804%. The permanent interest rate on the November 2014 debentures will be set in March 2015. The debentures have fixed interest rates and a 10 year maturity date.
The debentures outstanding at December 31, 2014 will mature as follows:
| Maturity Date |
Leverage | |||
| 2022 |
3,000,000 | |||
| 2023 |
2,500,000 | |||
| 2024 |
1,500,000 | |||
| 2025 |
1,000,000 | |||
|
|
|
|||
| Total Outstanding |
$ | 8,000,000 | ||
|
|
|
|||
The Corporation was required to pay the SBA a commitment fee equal to 1% of the face amount of the SBA leverage reserved as a partial prepayment of the SBA’s nonrefundable 3% leverage draw fees. Commitment and leverage draw fees of $24,250, $72,750 and $97,000 were paid during the years ended December 31, 2014, 2013 and 2012, respectively.
The Corporation has consented to the exercise by the SBA of all rights of the SBA under 13 C.F.R. 107.1810(i) “SBA remedies for automatic events of default” and has agreed to take all actions that the SBA may so require, which may include our automatic consent to the appointment of SBA or its designee as receiver under section 311(c) of the Act.
NOTE 6. – STOCKHOLDERS’ EQUITY (NET ASSETS)
At December 31, 2014 and 2013, there were 500,000 shares of $10.00 par value preferred stock authorized and unissued.
On October 24, 2013, the Board of Directors authorized the repurchase of up to 1,000,000 shares of the Corporation’s outstanding common stock on the open market through November 1, 2014 at prices that are no greater than the then current net asset value. On October 23, 2014, the Board of Directors extended the repurchase authorization of the Corporation’s outstanding common stock on the open market through October 23, 2015 at prices that are no greater than the then current net asset value. During 2014, the Corporation repurchased 83,380 shares for $257,372 and paid an average of $3.09 per share. At December 31, 2014, the total treasury shares held was 534,496 shares with a total cost of $1,447,491.
58
RAND CAPITAL CORPORATION AND SUBSIDIARY
NOTES TO THE CONSOLIDATED FINANCIAL STATEMENTS
Summary of change in equity accounts:
| Accumulated Net Investment Loss |
Undistributed Net Realized Gain on Investments |
Net Unrealized Appreciation on Investments |
||||||||||
| Balance, December 31, 2012 |
($ | 1,043,795 | ) | $ | 9,148,536 | $ | 7,013,260 | |||||
|
|
|
|
|
|
|
|||||||
| Net increase (decrease) in net assets from operations |
154,478 | 4,374,354 | (1,655,475 | ) | ||||||||
|
|
|
|
|
|
|
|||||||
| Balance, December 31, 2013 |
($ | 889,317 | ) | $ | 13,522,890 | $ | 5,357,785 | |||||
|
|
|
|
|
|
|
|||||||
| Net increase (decrease) in net assets from operations |
21,835 | 4,767,484 | (247,838 | ) | ||||||||
|
|
|
|
|
|
|
|||||||
| Balance, December 31, 2014 |
($ | 867,482 | ) | $ | 18,290,374 | $ | 5,109,947 | |||||
|
|
|
|
|
|
|
|||||||
NOTE 7. – STOCK OPTION PLANS
In 2001 the stockholders of the Corporation authorized the establishment of an Employee Stock Option Plan (the “Option Plan”), that provides for the award of options to purchase up to 200,000 common shares to eligible employees. In 2002, the Corporation placed the Option Plan on inactive status as it developed a new profit sharing plan for the Corporation’s executive officers in connection with the formation of its SBIC subsidiary. As of December 31, 2014, 2013 and 2012, no stock options had been awarded under the Option Plan. Because Section 57(n) of the 1940 Act prohibits maintenance of a profit sharing plan for the officers and employees of a BDC where any option, warrant or right is outstanding under an executive compensation plan, no options will be granted under the Option Plan while any profit sharing plan is in effect with respect to the Corporation (See Note 8).
NOTE 8. – EMPLOYEE BENEFIT PLANS
The Corporation has a defined contribution 401(k) Plan (the “401K Plan”). The 401K Plan provides a base contribution of 1% for eligible employees and also provides up to 5% matching contributions. The employer contributions to the 401K Plan amounted to $55,690, $40,710 and $32,222 for the years ended December 31, 2014, 2013 and 2012, respectively.
In 2002, the Corporation established a Profit Sharing Plan (the “Plan”) for its executive officers in accordance with Section 57(n) of the 1940 Act. Under the Plan, the Corporation will pay its executive officers aggregate profit sharing payments equal to 12% of the net realized capital gains of its SBIC subsidiary, net of all realized capital losses and unrealized depreciation of the SBIC subsidiary, for the fiscal year, computed in accordance with the Plan and the Corporation’s interpretation of the Plan. Any profit sharing paid or accrued cannot exceed 20% of the Corporation’s net income, as defined. For purposes of the 20% profit sharing test, the Corporation interprets net income to be the total of the Corporation’s net investment gain (loss) and its net realized gain (loss) on investments, prior to inclusion of the estimated profit sharing obligation. The profit sharing payments are split equally between the Corporation’s two executive officers, each of whom is fully vested in the Plan.
The Corporation accrued $899,500, $887,244 and $246,000 under the Plan for the years ended December 31, 2014, 2013 and 2012. Estimated payroll taxes and benefits on the profit sharing have been accrued at December 31, 2014, 2013 and 2012. The amounts approved do not exceed the defined limits.
NOTE 9. – COMMITMENTS AND CONTINGENCIES
The Corporation has an agreement which provides health benefits for the spouse of a former officer of the Corporation. Remaining payments projected to be paid to the surviving spouse have been fully accrued. Total accrued health benefits under this agreement at December 31, 2014 and 2013 were $34,015 and $17,319, respectively.
59
RAND CAPITAL CORPORATION AND SUBSIDIARY
NOTES TO THE CONSOLIDATED FINANCIAL STATEMENTS
The Corporation has a lease for office space which expires in December 2020. Rent expense under this operating lease for the years ended December 31, 2014, 2013 and 2012 was $18,840, $18,480 and $18,126, respectively. The operating lease obligations are approximately as follows:
| Year |
Amount | |||
| 2015 |
$ | 18,200 | ||
| 2016 |
18,500 | |||
| 2017 |
18,800 | |||
| 2018 |
19,200 | |||
| Thereafter |
39,200 | |||
|
|
|
|||
| Total |
$ | 113,900 | ||
|
|
|
|||
NOTE 10. – UNCONSOLIDATED SIGNIFICANT SUBSIDIARY
In accordance with the SEC’s Regulation S-X Rule 4.08(g), the Corporation has an unconsolidated significant subsidiary that is not required to be consolidated. Accordingly, comparative financial information is presented below.
| For the years ended December 31, | ||||||||
| 2014 (000) |
2013 (000) |
|||||||
| Balance Sheet: |
||||||||
| Current assets |
$ | 18,136 | $ | 15,200 | ||||
| Non-current assets |
10,506 | 10,900 | ||||||
| Current liabilities |
7,438 | 3,900 | ||||||
| Non-current liabilities |
834 | 1,700 | ||||||
| Income Statement: |
||||||||
| Net sales |
$ | 29,875 | $ | 32,000 | ||||
| Gross profit |
7,537 | 8,100 | ||||||
| Net income |
4,727 | 5,100 | ||||||
NOTE 11. – QUARTERLY OPERATIONS AND EARNINGS DATA – UNAUDITED
| 4th Quarter |
3rd Quarter |
2nd Quarter |
1st Quarter |
|||||||||||||
| 2014 |
||||||||||||||||
| Investment income |
$ | 825,620 | $ | 569,349 | $ | 671,559 | $ | 517,947 | ||||||||
| Net increase (decrease) in net assets from operations |
3,967,876 | 223,442 | 519,776 | (169,613 | ) | |||||||||||
| Basic and diluted net increase (decrease) in net assets per share from operations |
$ | 0.63 | $ | 0.03 | $ | 0.08 | ($ | 0.03 | ) | |||||||
| 2013 |
||||||||||||||||
| Investment income |
$ | 438,210 | $ | 510,222 | 734,233 | $ | 768,371 | |||||||||
| Net increase (decrease) in net assets from operations |
3,039,642 | (244,292 | ) | 275,072 | (197,065 | ) | ||||||||||
| Basic and diluted net increase (decrease) in net assets per share from operations |
0.47 | (0.04 | ) | 0.04 | (0.03 | ) | ||||||||||
60
RAND CAPITAL CORPORATION AND SUBSIDIARY
NOTES TO THE CONSOLIDATED FINANCIAL STATEMENTS
NOTE 12. – ALLOWANCE FOR DOUBTFUL ACCOUNTS
The Corporation maintains an allowance for doubtful accounts for estimated uncollectible interest payments due from portfolio investments. The allowance for doubtful accounts is based on a review of the overall condition of the receivable balances and a review of past due amounts. Changes in the allowance for doubtful accounts consist of the following:
| 2014 | 2013 | 2012 | ||||||||||
| Balance at beginning of year |
($ | 122,000 | ) | ($ | 196,795 | ) | ($ | 122,000 | ) | |||
| Provision for losses |
(6,311 | ) | — | (74,795 | ) | |||||||
| Write offs/Recoveries |
— | 74,795 | — | |||||||||
|
|
|
|
|
|
|
|||||||
| Balance at end of year |
($ | 128,311 | ) | ($ | 122,000 | ) | ($ | 196,795 | ) | |||
|
|
|
|
|
|
|
|||||||
61
RAND CAPITAL CORPORATION AND SUBSIDIARY
SCHEDULE OF CONSOLIDATED CHANGES IN INVESTMENTS AT
COST AND REALIZED GAIN
For the Year Ended December 31, 2014
| Cost Increase (Decrease) |
Realized Gain (Loss) |
|||||||
| New and additions to previous investments |
||||||||
| Teleservices Solutions Holdings, LLC (Teleservices Holdings) |
$ | 1,400,680 | — | |||||
| SocialFlow, Inc. (Socialflow) |
750,000 | — | ||||||
| Chequed.com, Inc. (Chequed) |
600,000 | — | ||||||
| Empire Genomics, LLC (Empire Genomics) |
600,000 | — | ||||||
| Crashmob, Inc. (Crashmob) |
500,000 | — | ||||||
| SciAps, Inc. (Sciaps) |
500,000 | — | ||||||
| Knoa Software, Inc. (Knoa) |
479,155 | — | ||||||
| CrowdBouncer, Inc. (Crowdbouncer) |
300,000 | — | ||||||
| Knowledge Vison Inc. (Knowledge Vision) |
300,000 | — | ||||||
| Mercantile Adjustment Bureau, LLC (Mercantile) |
213,704 | — | ||||||
| OnCore Golf Technology, Inc. |
200,000 | — | ||||||
| First Wave Products Group, LLC (First Wave) |
170,844 | — | ||||||
| GiveGab, Inc. (Give Gab) |
153,388 | — | ||||||
| BeetNPath, LLC (Beetnpath) |
150,000 | — | ||||||
| Kinex Pharmaceuticals, Inc. (Kinex) |
143,285 | — | ||||||
| QuaDPharma, LLC (Quadpharma) exchange of membership interest for common stock of Kinex |
(143,285 | ) | — | |||||
|
|
|
|
|
|||||
| 6,317,771 | — | |||||||
| Investments repaid, sold or liquidated |
||||||||
| BinOptics Corporation (Binoptics) |
(1,799,999 | ) | $ | 8,333,344 | ||||
| EmergingMed.com, Inc. (Emerging Med) |
(778,253 | ) | (778,253 | ) | ||||
| Quadpharma repayment |
(763,001 | ) | 160,634 | |||||
| Gemcor II, LLC (Gemcor) repayment |
(287,518 | ) | — | |||||
| Synacor, Inc. (Synacor) |
(239,998 | ) | (9,792 | ) | ||||
| Carolina Skiff LLC (Carolina Skiff) repayment |
(125,000 | ) | — | |||||
| NDT Acquisitions, LLC (NDT) |
(5,336 | ) | — | |||||
| Liazon Corporation |
— | (472,664 | ) | |||||
| Ultra-Scan Corporation (Ultra-Scan) |
— | 4,668 | ||||||
|
|
|
|
|
|||||
| (3,999,105 | ) | 7,237,937 | ||||||
|
|
|
|
|
|||||
| Net change in investments, at cost |
$ | 2,318,666 | $ | 7,237,937 | ||||
|
|
|
|
|
|||||
62
REPORT OF INDEPENDENT REGISTERED PUBLIC ACCOUNTING FIRM
To the Board of Directors and Stockholders
Rand Capital Corporation and Subsidiary
We have audited the accompanying consolidated statements of financial position of Rand Capital Corporation and Subsidiary (the “Corporation”) as of December 31, 2014 and 2013, including the consolidated schedule of portfolio investments as of December 31, 2014 and 2013, and the related consolidated statements of operations, cash flows and changes in net assets for each of the three years in the period ended December 31, 2014, and the financial highlights schedule for each of the five years in the period then ended. These consolidated financial statements and the financial highlights schedule are the responsibility of the Corporation’s management. Our responsibility is to express an opinion on these consolidated financial statements and financial highlights schedule based on our audits.
We conducted our audits in accordance with the standards of the Public Company Accounting Oversight Board (United States). Those standards require that we plan and perform the audit to obtain reasonable assurance about whether the financial statements and financial highlights schedule are free of material misstatement. The Corporation is not required to have, nor were we engaged to perform, an audit of its internal control over financial reporting. Our audits included consideration of internal control over financial reporting as a basis for designing audit procedures that are appropriate in the circumstances, but not for the purpose of expressing an opinion on the effectiveness of the Corporation’s internal control over financial reporting. Accordingly, we express no such opinion. An audit includes examining, on a test basis, evidence supporting the amounts and disclosures in the financial statements. Our procedures included examination or confirmation of securities owned as of December 31, 2014 and 2013. An audit also includes assessing the accounting principles used and significant estimates made by management, as well as evaluating the overall financial statement presentation. We believe that our audits provide a reasonable basis for our opinion.
In our opinion, the consolidated financial statements and financial highlights schedule referred to above present fairly, in all material respects, the financial position of the Corporation as of December 31, 2014 and 2013, the results of their operations, their cash flows and the changes in their net assets for each of the three years in the period ended December 31, 2014, and the financial highlights schedule for each of the five years in the period then ended, in conformity with U.S. generally accepted accounting principles.
As discussed in Note 2, the investment securities included in the consolidated financial statements valued at $30,305,376 (94% of net assets) and $28,348,553 (101% of net assets) as of December 31, 2014 and 2013, respectively include securities valued at $29,699,376 and $27,294,053, respectively, whose fair values have been estimated by management in the absence of readily ascertainable fair value. The fair value estimates are then approved by the Board of Directors. We have reviewed the procedures used by management in preparing the valuations of investment securities and have inspected the underlying documentation, and in the circumstances we believe the procedures are reasonable and the documentation appropriate. Those estimated values may differ from the values that would have been used had a ready market for the investments existed.
The supplementary schedule of consolidated changes in investments at cost and realized gain for the year ended December 31, 2014 has been subjected to audit procedures performed in conjunction with the audit of the Corporation’s consolidated financial statements. The supplemental information is the responsibility of the Corporation’s management. Our audit procedures included determining whether the supplemental information reconciles to the consolidated financial statements or the underlying accounting and other records, as applicable, and performing procedures to test the completeness and accuracy of the information presented in the supplemental information. In our opinion, the supplemental schedule of consolidated changes in investments at cost and realized gain for the year ended December 31, 2014 is fairly stated, in all material respects, in relation to the financial statements as a whole.
/s/ FREED MAXICK CPAs, P.C.
Buffalo, New York
March 12, 2015
63
Item 9. Changes in and Disagreements with Accountants on Accounting and Financial Disclosure
None
Item 9A. Controls and Procedures
Management Report on Internal Control Over Financial Reporting. The management of the Corporation is responsible for establishing and maintaining adequate internal control over financial reporting. The Corporation’s internal control system is a process designed to provide reasonable assurance to the Corporation’s management and board of directors regarding the preparation and fair presentation of published financial statements.
Management assessed the effectiveness of the Corporation’s internal control over financial reporting as of December 31, 2014. In making this assessment, management used the criteria set forth by the Committee of Sponsoring Organizations of the Treadway Commission in Internal Control-Integrated Framework (1992). Based on its assessment, management believes that, as of December 31, 2014, the Corporation’s internal control over financial reporting is effective based on those criteria.
Disclosure Controls and Procedures. The Corporation maintains disclosure controls and procedures that are designed to ensure that information required to be disclosed in reports that it files or submits under the Securities Exchange Act of 1934 is recorded, processed, summarized, and reported within the time periods specified in the SEC’s rules and forms, and that this information is accumulated and communicated to management, including the Chief Executive Officer and the Chief Financial Officer, as appropriate, to allow timely decisions regarding required disclosure. The Chief Executive Officer and the Chief Financial Officer carried out an evaluation of the effectiveness of the design and operation of the Corporation’s disclosure controls and procedures as of December 31, 2014. Based on the evaluation of these disclosure controls and procedures, the Chief Executive Officer and Chief Financial Officer concluded that the Corporation’s controls and procedures were effective as of December 31, 2014.
This annual report does not include an attestation report of the Corporation’s registered public accounting firm regarding internal control over financial reporting. Management’s report was not subject to attestation by the corporation’s registered public accounting firm pursuant to rules of the Securities and Exchange Commission that permit the corporation to provide only management’s report in this Annual Report.
Changes in Internal Control over Financial Reporting. There have been no changes in our internal control over financial reporting during the Corporation’s most recent fiscal quarter that have materially affected, or are reasonably likely to materially affect, the Corporation’s internal control over financial reporting.
None
Item 10. Directors, Executive Officers, and Corporate Governance
Information in response to this Item is incorporated herein by reference to the information under the headings “ PROPOSAL 1 – ELECTION OF DIRECTORS”, “COMMITTEES AND MEETING DATA,” and “Section 16(a) Beneficial Ownership Compliance” provided in the Corporation’s definitive Proxy Statement for its 2014 Annual Meeting of Shareholders, to be filed under Regulation 14A (the “2015 Proxy Statement”).
The Corporation has adopted a written Code of Ethics that applies to our principal executive officer, principal financial officer and vice president of finance, and a Business Ethics Policy applicable to the Corporation’s directors, officers and employees. The Corporation’s Code of Ethics and Business Ethics Policy are available, free of charge, in the Governance section of the Corporation’s website located at www.randcapital.com.
64
Item 11. Executive Compensation
Information in response to this Item is incorporated herein by reference to the information provided in the Corporation’s 2015 Proxy Statement under the headings “COMPENSATION DISCUSSION AND ANALYSIS” and “DIRECTOR COMPENSATION.”
Item 12. Security Ownership of Certain Beneficial Owners and Management and Related Stockholder Matters
Information in response to this Item is incorporated herein by reference to the information provided in the Corporation’s 2015 Proxy Statement under the heading “BENEFICIAL OWNERSHIP OF SHARES.”
Item 13. Certain Relationships and Related Transactions and Director Independence
Information in response to this Item is incorporated herein by reference to the information in the Corporation’s 2015 Proxy Statement under the heading “DIRECTOR INDEPENDENCE.”
Item 14. Principal Accountant Fees and Services
Information concerning the Corporation’s independent auditors, the audit committee’s pre-approval policy for audit services and our principal accountant fees and services is contained in the Corporation’s 2015 Proxy Statement under the heading “INDEPENDENT REGISTERED PUBLIC ACCOUNTANT (INDEPENDENT ACCOUNTANT) FEES”.
Item 15. Exhibits, Financial Statement Schedules
| (a) | The following documents are filed as part of this report and included in Item 8: |
| (1) | CONSOLIDATED FINANCIAL STATEMENTS |
Statements of Financial Position as of December 31, 2014 and 2013
Statements of Operations for the three years in the period ended December 31, 2014
Statements of Changes in Net Assets for the three years in the period ended December 31, 2014
Statements of Cash Flows for the three years in the period ended December 31, 2014
Schedule of Portfolio Investments as of December 31, 2014
Schedule of Portfolio Investments as of December 31, 2013
Financial Highlights Schedule for the five years in the period ended December 31, 2014
Notes to the Consolidated Financial Statements
Supplemental Schedule of Consolidated Changes in Investments at Cost and Realized Gain for the year ended December 31, 2014
Report of Independent Registered Public Accounting Firm
| (2) | FINANCIAL STATEMENT SCHEDULES |
The required financial statement Schedule II – Valuation and Qualifying Accounts has been omitted because the information required is included in the note 12 to the consolidated financial statements.
| (b) | The following exhibits are filed with this report or are incorporated herein by reference to a prior filing, in accordance with Rule 12b-32 under the Securities Exchange Act of 1934. |
| (3.1)(i) | Certificate of Incorporation of the Corporation, incorporated by reference to Exhibit (a)(1) of Form N-2 filed with the Securities Exchange Commission on April 22, 1997. (File No. 814-00235). |
65
| (3.1)(ii) | By-laws of the Corporation incorporated by reference to Exhibit (b) of Form N-2 filed with the Securities Exchange Commission on April 22, 1997. (File No. 814-00235). |
| (4) | Specimen certificate of common stock certificate, incorporated by reference to Exhibit (b) of Form N-2 filed with the Securities Exchange Commission on April 22, 1997. (File No. 814-00235). |
| (10.1) | Employee Stock Option Plan – incorporated by reference to Appendix B to the Corporation’s definitive Proxy Statement filed on June 8, 2001.* (File No. 811-01825). |
| (3.2)(i) | Certificate of Incorporation of Rand Merger Corporation as filed by the NY Department of State on 12/18/08 – incorporated by reference to Exhibit 1(a) to Registration Statement No. 811-22276 on Form N-5 of Rand Capital SBIC, Inc. filed with the SEC on February 6, 2009. (File No. 811-22276). |
| (3.2)(ii) | By-laws of Rand Capital SBIC, Inc. – incorporated by reference to Exhibit 2 to Registration Statement No. 811-22276 on Form N-5 of Rand Capital SBIC, Inc. filed with the SEC on February 6, 2009. (File No. 811-22276). |
| (10.2) | Certificate of Merger of Rand Capital SBIC, L.P. and Rand Capital Management, LLC into Rand Merger Corporation, as filed by the NY Department of State on 12/18/08 – incorporated by reference to Exhibit 1(b) to Registration Statement No. 811-22276 on Form N-5 of Rand Capital SBIC, Inc. filed with the SEC on February 6, 2009 (File No. 811-22276). |
| (10.3) | Rand Capital Corporation Amended and Restated Profit Sharing Plan applicable to Rand Capital SBIC, Inc. – incorporated by reference to Exhibit 7 to Registration Statement No. 811-22276 on Form N-5 of Rand Capital SBIC, Inc. filed with the SEC on February 6, 2009. (File No. 811-22276)* |
| (31.1) | Certification of Principal Executive Officer Pursuant to Rules 13a-14(a)/15d-14(a) under the Securities Exchange Act of 1934, as amended – filed herewith. |
| (31.2) | Certification of Principal Financial Officer Pursuant to Rules 13a-14(a)/15d-14(a) under the Securities Exchange Act of 1934, as amended – filed herewith. |
| (32.1) | Certification Pursuant to Section 906 of the Sarbanes-Oxley Act of 2002 – Rand Capital Corporation – filed herewith. |
| * | Management contract or compensatory plan. |
66
Signatures
Pursuant to the requirements of Section 13 or 15(d) of Securities Exchange Act of 1934, the registrant has duly caused this Report on Form 10-K to be signed on its behalf by the undersigned thereunto duly authorized.
| Date: March 12, 2015 | RAND CAPITAL CORPORATION | |||
| By: | /s/ Allen F. Grum | |||
| Allen F. Grum, President | ||||
Pursuant to the requirements of the Securities Exchange Act of 1934, this Report on Form 10-K has been signed below by the following persons on behalf of the Corporation in the capacities and on the date indicated.
| Signature/Title |
||
| (i) Principal Executive Officer: |
||
| /s/ Allen F. Grum Allen F. Grum / President |
March 12, 2015 | |
| (ii) Principal Accounting & Financial Officer: |
||
| /s/ Daniel P. Penberthy Daniel P. Penberthy / Treasurer |
March 12, 2015 | |
| (iii) Directors: |
||
| /s/ Allen F. Grum Allen F. Grum / Director |
March 12, 2015 | |
| /s/ Erland E. Kailbourne Erland E. Kailbourne / Director |
March 12, 2015 | |
| /s/ Ross B. Kenzie Ross B. Kenzie / Director |
March 12, 2015 | |
| /s/ Robert S. McLeese Robert S. McLeese / Director |
March 12, 2015 | |
| /s/ Reginald B. Newman II Reginald B. Newman II / Director |
March 12, 2015 | |
| /s/ E. Wycliffe Orr, Jr. E. Wycliffe Orr, Jr / Director |
March 12, 2015 | |
| /s/ Jayne K. Rand Jayne K. Rand / Director |
March 12, 2015 | |
| /s/ Robert M. Zak Robert M. Zak / Director |
March 12, 2015 | |
67